HOT TOPICS LIST
- MACD
- Fibonacci
- RSI
- Gann
- ADXR
- Stochastics
- Volume
- Triangles
- Futures
- Cycles
- Volatility
- ZIGZAG
- MESA
- Retracement
- Aroon
INDICATORS LIST
LIST OF TOPICS
PRINT THIS ARTICLE
by Matt Blackman
I have written articles about bearish intermarket and chart pattern omens that have been flashing in markets. Here is another one.
Position: Sell
Matt Blackman
Matt Blackman is a full-time technical and financial writer and trader. He produces corporate and financial newsletters, and assists clients in getting published in the mainstream media. He is the host of TradeSystemGuru.com. Matt has earned the Chartered Market Technician (CMT) designation. Find out what stocks and futures Matt is watching on Twitter at www.twitter.com/RatioTrade
PRINT THIS ARTICLE
BOND & INTEREST RATE
Bond Spreads Signal Possible
05/24/12 09:00:09 AMby Matt Blackman
I have written articles about bearish intermarket and chart pattern omens that have been flashing in markets. Here is another one.
Position: Sell
| There have been some troubling intermarket and chart pattern signals flash since March 2012. Bearish indicators include eurodollar futures ("Another Sign Of A Market Top," Traders.com Advantage, March 8, 2012), diverging small caps ("In A Topping Market," Traders.com Advantage, March 9, 2012), bearish head & shoulders patterns ("Bearish Omen For US Stocks," Traders.com Advantage, April 19, 2012) and falling commodity prices ("What Is Intermarket Analysis Saying About Markets?" Traders.com Advantage, April 20, 2012). |
| A very interesting interview on May 18 with Michael Gayed, Chief Investment Strategist for Pension Partners highlighted another one. Junk bond prices have been collapsing, while 20-to 30-year US Treasuries jumped, which he believes is signaling a potential US "credit event." |

|
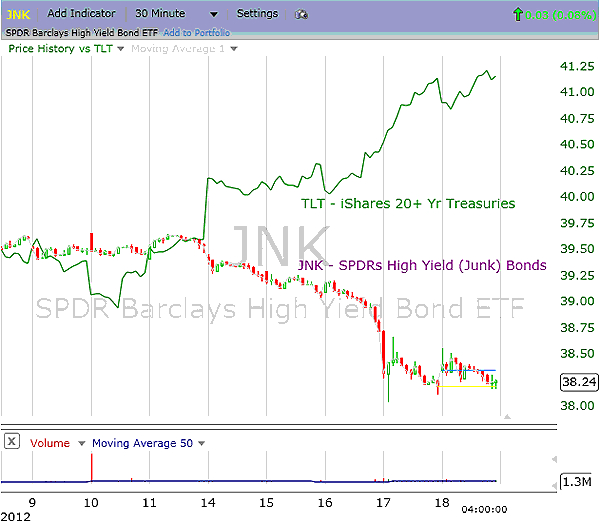
| FIGURE 1: TLT, JNK, HOURLY. This chart shows spreads widening in May 2012. |
| Graphic provided by: FreeStockCharts.com. |
| |
| As the hourly chart of the SPDR Barclays High Yield Bond ETF (JNK) together with the iShares 20+ Year Treasuries in Figure 1 demonstrates, spreads have widened dramatically since May 14, indicating a dramatic flight to safety by bond traders, which is bullish for the US dollar. But this is a decidedly bearish development for stocks, according to Gayed. |

|
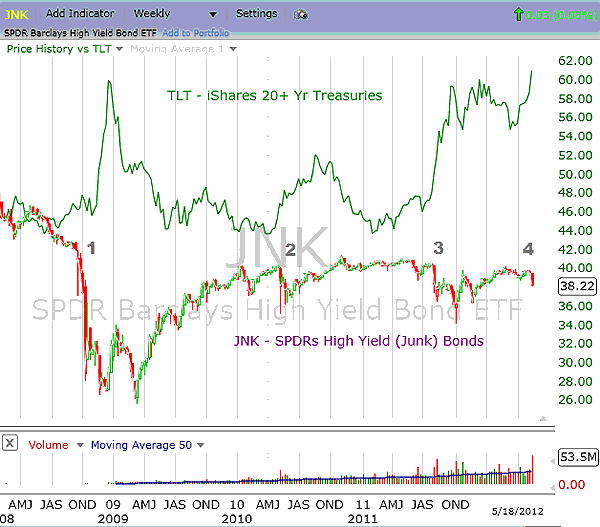
| FIGURE 2: TLT, JNK, WEEKLY. This chart shows the longer-term relationship between the two since 2008. |
| Graphic provided by: FreeStockCharts.com. |
| |
| What precedents are there for such an occurrence? On May 6, 2010, junk bond prices collapsed one hour before the Dow Jones Industrial Average (DJIA) began dropping 1,000 points, in what later became known as the "flash crash," according to Gayed. Figure 2 shows the same issues on a weekly chart. Point 1 on the left shows spreads widened dramatically, leading up to the 2008 stock market meltdown, the surge leading up to the flash crash in May 2010 (point 2), again in late July 2011 (point 3) followed by surging spreads recently (point 4). |

|
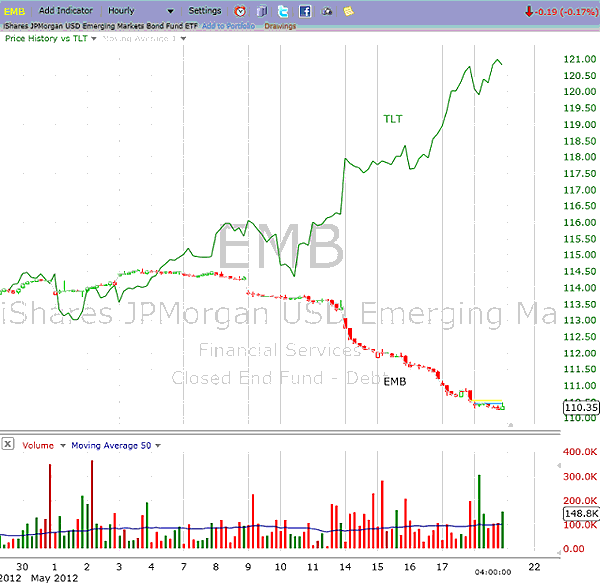
| FIGURE 3: TLT, EMB, HOURLY. This chart of iShares 20+ Year Treasury Bond ETF (TLT) and iShares JPMorgan USD Emerging Market Bond Fund ETF (EMB) shows rapidly widening spread between the two in May 2012. |
| Graphic provided by: FreeStockCharts.com. |
| |
| To further strengthen his claim, Gayed pointed to a similar development with emerging market bonds and US Treasuries using TLT and EMB exchange traded funds (ETFs), as well as in US corporate high-yield bond prices. See Figure 3. His concerns stem from the speed and magnitude at which bond spreads are widening, which indicates a panic of sorts with bond traders. Given the historical intermarket relationship between bonds, stocks, and commodities that tend to move in that order, it is a development that stock traders should not ignore. |
Matt Blackman is a full-time technical and financial writer and trader. He produces corporate and financial newsletters, and assists clients in getting published in the mainstream media. He is the host of TradeSystemGuru.com. Matt has earned the Chartered Market Technician (CMT) designation. Find out what stocks and futures Matt is watching on Twitter at www.twitter.com/RatioTrade
| Company: | TradeSystemGuru.com |
| Address: | Box 2589 |
| Garibaldi Highlands, BC Canada | |
| Phone # for sales: | 604-898-9069 |
| Fax: | 604-898-9069 |
| Website: | www.tradesystemguru.com |
| E-mail address: | indextradermb@gmail.com |
Traders' Resource Links | |
| TradeSystemGuru.com has not added any product or service information to TRADERS' RESOURCE. | |
Click here for more information about our publications!
PRINT THIS ARTICLE

|

Request Information From Our Sponsors
- StockCharts.com, Inc.
- Candle Patterns
- Candlestick Charting Explained
- Intermarket Technical Analysis
- John Murphy on Chart Analysis
- John Murphy's Chart Pattern Recognition
- John Murphy's Market Message
- MurphyExplainsMarketAnalysis-Intermarket Analysis
- MurphyExplainsMarketAnalysis-Visual Analysis
- StockCharts.com
- Technical Analysis of the Financial Markets
- The Visual Investor
- VectorVest, Inc.
- Executive Premier Workshop
- One-Day Options Course
- OptionsPro
- Retirement Income Workshop
- Sure-Fire Trading Systems (VectorVest, Inc.)
- Trading as a Business Workshop
- VectorVest 7 EOD
- VectorVest 7 RealTime/IntraDay
- VectorVest AutoTester
- VectorVest Educational Services
- VectorVest OnLine
- VectorVest Options Analyzer
- VectorVest ProGraphics v6.0
- VectorVest ProTrader 7
- VectorVest RealTime Derby Tool
- VectorVest Simulator
- VectorVest Variator
- VectorVest Watchdog
