HOT TOPICS LIST
- MACD
- Fibonacci
- RSI
- Gann
- ADXR
- Stochastics
- Volume
- Triangles
- Futures
- Cycles
- Volatility
- ZIGZAG
- MESA
- Retracement
- Aroon
INDICATORS LIST
LIST OF TOPICS
PRINT THIS ARTICLE
by Donald W. Pendergast, Jr.
After plunging by more than 40% between November 8, 2011, and May 16, 2012, are shares of Newmont Mining a value investor's best friend?
Position: N/A
Donald W. Pendergast, Jr.
Donald W. Pendergast is a financial markets consultant who offers specialized services to stock brokers and high net worth individuals who seek a better bottom line for their portfolios.
PRINT THIS ARTICLE
TECHNICAL ANALYSIS
Time To Accumulate Newmont Mining?
05/24/12 08:44:23 AMby Donald W. Pendergast, Jr.
After plunging by more than 40% between November 8, 2011, and May 16, 2012, are shares of Newmont Mining a value investor's best friend?
Position: N/A
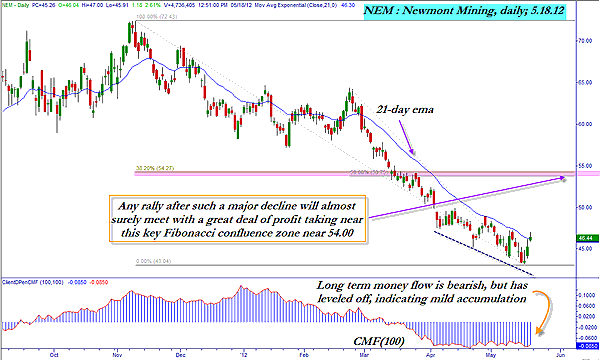
| If there's one thing about gold mining shares that is fairly certain, it's this: You probably won't have to wait too long to see a substantial, tradable move in either direction, volatile as they can be. Let's examine Newmont Mining's (NEM) recent six-month slide and seek to determine if the stock is a good scale-in opportunity for value-oriented, longer-term gold bugs. Here's a look at NEM's daily chart now (Figure 1). |

|
| FIGURE 1: NEM, DAILY. Money flow analysis can frequently identify patterns of accumulation and distribution in most freely traded, liquid markets. Here, the 100-period Chaikin money flow histogram suggests that mild accumulation is under way in shares of Newmont Mining. |
| Graphic provided by: TradeStation. |
| |
| Even though volatile and sometimes long-lasting trend moves are the norm for precious metals stocks like NEM, it's still a big deal anytime a large-cap stock from any industry group loses more than 40% of its value in a six-month time window. During such a selloff, traders are seeking to profit from each new breakdown even as fundamentally based investors continue to evaluate the stock's earnings growth potential. As the stock continues to fall -- sometimes for days on end -- these value investors may be tempted to establish a small long position, followed by another and another. Finally, the stock bottoms out and begins the sometimes-painful process of reversing higher. Is there a technical indicator that can identify this process where value/long-term investors begin to build new positions in a declining, yet fundamentally attractive stock? Perhaps there is, although NO technical tool can ever hope to provide a 100% accurate timing window for any market reversal or turning point. |

|
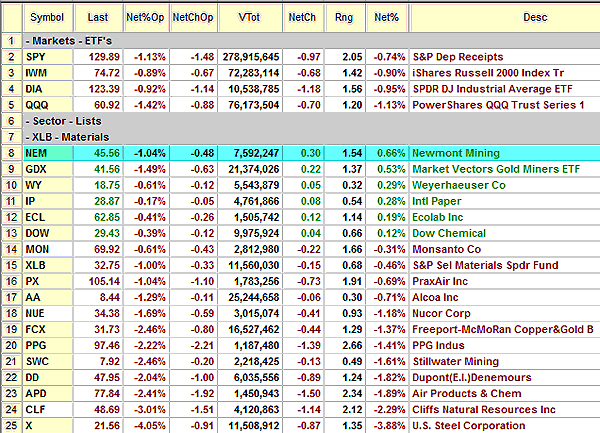
| FIGURE 2: NEM. Newmont Mining manages to close higher with a modest gain on May 18, 2012, despite negative closes for the major US stock indexes. |
| Graphic provided by: TradeStation. |
| |
| One of the better indicators for identifying accumulation and distribution is the trusty Chaikin money flow indicator. Here, it's plotted as a 100-period histogram (CMF)(100), and without getting into the actual math formula behind the indicator, what it is telling traders and investors is this: 1. As NEM continued to slide southward after making a minor swing low on April 23, 2012, the money flow histogram ceased to make new lows and in fact increases in value even as NEM continued to shed another $2 in value per share. 2. Since this is a 100-period version of the money flow histogram, it is likely that it is longer-term investors rather than short-term swing traders who are attempting to build small positions in NEM in anticipation of a possible relief rally later this spring. 3. A minor amount of short-covering -- followed by a modest rally --has now been under way for the past three trading sessions, but it's impossible to know if a real reversal can take root before a pullback test of the May 16, 2012, low of 43.23 occurs. NEM ran up toward and then slightly beyond its 21-day exponential moving average (EMA) early in trading on May 18, 2012, and has since pulled back. See Figure 2. |
| So, longer-term and/or value investors have at least a few hopeful signs of a possible reversal in NEM. What to do about it? One idea might be to sell near-term out-of-the-money put options; the options should have four weeks or less of time value remaining. NEM has a reasonable amount of support near 41.40, so the sale of near-term 40.00 or 37.50 strike put options might be just the ticket here, especially if Friday's high of 47.00 is exceeded within the next few sessions. Managing a position like this is simple; if the option withers away to only 20% or 30% of the amount you sold it for, just buy it back and walk away happy, with some money in your pocket. If the put doubles in price, buy it back immediately so you don't end up with a major loss on your hands. |
Donald W. Pendergast is a financial markets consultant who offers specialized services to stock brokers and high net worth individuals who seek a better bottom line for their portfolios.
| Title: | Writer, market consultant |
| Company: | Linear Trading Systems LLC |
| Jacksonville, FL 32217 | |
| Phone # for sales: | 904-239-9564 |
| E-mail address: | lineartradingsys@gmail.com |
Traders' Resource Links | |
| Linear Trading Systems LLC has not added any product or service information to TRADERS' RESOURCE. | |
Click here for more information about our publications!
PRINT THIS ARTICLE

Request Information From Our Sponsors
- StockCharts.com, Inc.
- Candle Patterns
- Candlestick Charting Explained
- Intermarket Technical Analysis
- John Murphy on Chart Analysis
- John Murphy's Chart Pattern Recognition
- John Murphy's Market Message
- MurphyExplainsMarketAnalysis-Intermarket Analysis
- MurphyExplainsMarketAnalysis-Visual Analysis
- StockCharts.com
- Technical Analysis of the Financial Markets
- The Visual Investor
- VectorVest, Inc.
- Executive Premier Workshop
- One-Day Options Course
- OptionsPro
- Retirement Income Workshop
- Sure-Fire Trading Systems (VectorVest, Inc.)
- Trading as a Business Workshop
- VectorVest 7 EOD
- VectorVest 7 RealTime/IntraDay
- VectorVest AutoTester
- VectorVest Educational Services
- VectorVest OnLine
- VectorVest Options Analyzer
- VectorVest ProGraphics v6.0
- VectorVest ProTrader 7
- VectorVest RealTime Derby Tool
- VectorVest Simulator
- VectorVest Variator
- VectorVest Watchdog
