

HOT TOPICS LIST
- MACD
- Fibonacci
- RSI
- Gann
- ADXR
- Stochastics
- Volume
- Triangles
- Futures
- Cycles
- Volatility
- ZIGZAG
- MESA
- Retracement
- Aroon
INDICATORS LIST
LIST OF TOPICS
PRINT THIS ARTICLE
by Donald W. Pendergast, Jr.
Are shares of Sprint Nextel on track to make a new all-time low, even below its 2008 post-crash low of $1.35?
Position: N/A
Donald W. Pendergast, Jr.
Donald W. Pendergast is a financial markets consultant who offers specialized services to stock brokers and high net worth individuals who seek a better bottom line for their portfolios.
PRINT THIS ARTICLE
TRADING SYSTEMS
Sprint Nextel New Short Signal
05/23/12 09:26:38 AMby Donald W. Pendergast, Jr.
Are shares of Sprint Nextel on track to make a new all-time low, even below its 2008 post-crash low of $1.35?
Position: N/A
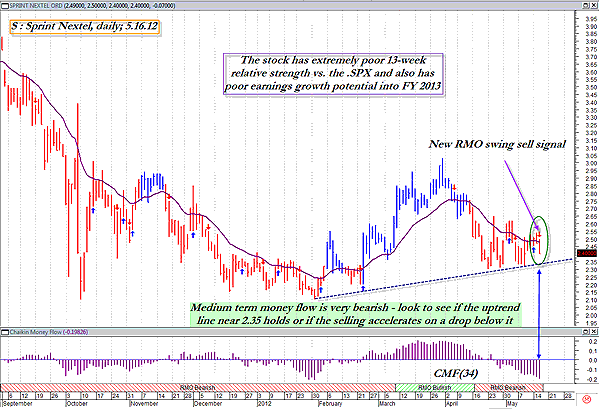
| Sprint Nextel (S) did very well during the go-go 1990s, rising from 5.16 in November 1990 all the way up to 75.94 in November 1999. Not a bad return, especially for long-term, buy & hold types. The bear markets of 2000-02 and 2007 to the present simply devastated the stock, despite a strong rebound rally that lasted from mid-2002 to mid-2005. Today, the stock trades in the lower $2.00 range, and with poor earnings growth potential through 2013, it's hard to envision the stock ever attaining a price level anywhere approaching those seen in the late 1990s. Figure 1 is a closer look at Sprint's daily chart now. |
|
| FIGURE 1: S, DAILY. The uptrend line connecting all of the recent swing lows is really beginning to look like a major line in the sand for shares of Sprint Nextel. |
| Graphic provided by: MetaStock. |
| Graphic provided by: RMO indicators from MetaStock 11. |
| |
| Not a pretty picture, that much is for certain. With the stock now trading only $1 higher than its all-time low of $1.35, it wouldn't take too much selling pressure to bring it down to that 2008 low in the next few weeks. A brand-new RMO (Rahul Mohindar) swing sell signal has just printed, and the big question is whether this trade gets triggered soon (at a price of $2.39 or below), and if it does, will the downthrust be strong enough to overcome the next significant support level near $2.30 to $2.35? The stock's medium-term money flow (depicted by the 34-period Chaikin money flow histogram [CMF][34]) is in extremely bearish territory, suggesting that the sellers currently have the upper hand in this beaten-down stock. S also features absolutely abysmal 13-week relative strength vs. the Standard & Poor's 500 (SPX) (Figure 2), yet another bearish factor to consider here. With S also pinned between its 21-period exponential moving average (EMA) and its uptrend line, which forms a triangle pattern of sorts, the technical situation may be shaping up for a strong, tradable move in either direction. |
|
| FIGURE 2: RELATIVE STRENGTH VS. SPX. Sprint Nextel has truly horrid 13-week relative strength vs. the .SPX, and it could fare even worse if its support at $2.30 to $2.35 is breached on big volume. |
| Graphic provided by: MetaStock. |
| |
| The broad US markets are in full-tilt corrective mode now, and a few more days of heavy selling may still be required to cleanse the market of excessive fear and panic before a tradable bounce can appear. This could be one of the better short setups around -- on both a technical and fundamental basis -- and here's an idea on how to play S on the short side; put half of your short position on a break below $2.40, set an initial stop at $2.55, and then wait to see if $2.30 is broken. If it does break below, put on the other half of your position and start running a two-bar trailing stop of the daily highs until stopped out. With the market so bearish, and with the stock's horrible earnings and relative strength situation, this might be one of those times when it simply pays to just let a trade run without setting profit targets or scaling out. The SPX is due to make a major multicycle low within the next four to six weeks, and unless something radically changes with Sprint Nextel's earnings growth projection soon, this stock is likely to keep getting decimated at the powerful down cycles in the SPX as other stock indexes pull it lower and lower. And for those value traders who believe S could be a great scale-in or buy-the-dips play, well, forget it. A stock is a great value play when its earnings growth projections begin to turn up, and until that happens, don't even think of trying to nail a bargain on a stock that might actually end up being delisted from the major stock indexes. |
Donald W. Pendergast is a financial markets consultant who offers specialized services to stock brokers and high net worth individuals who seek a better bottom line for their portfolios.
| Title: | Writer, market consultant |
| Company: | Linear Trading Systems LLC |
| Jacksonville, FL 32217 | |
| Phone # for sales: | 904-239-9564 |
| E-mail address: | lineartradingsys@gmail.com |
Traders' Resource Links | |
| Linear Trading Systems LLC has not added any product or service information to TRADERS' RESOURCE. | |
Click here for more information about our publications!
PRINT THIS ARTICLE

Request Information From Our Sponsors
- StockCharts.com, Inc.
- Candle Patterns
- Candlestick Charting Explained
- Intermarket Technical Analysis
- John Murphy on Chart Analysis
- John Murphy's Chart Pattern Recognition
- John Murphy's Market Message
- MurphyExplainsMarketAnalysis-Intermarket Analysis
- MurphyExplainsMarketAnalysis-Visual Analysis
- StockCharts.com
- Technical Analysis of the Financial Markets
- The Visual Investor
- VectorVest, Inc.
- Executive Premier Workshop
- One-Day Options Course
- OptionsPro
- Retirement Income Workshop
- Sure-Fire Trading Systems (VectorVest, Inc.)
- Trading as a Business Workshop
- VectorVest 7 EOD
- VectorVest 7 RealTime/IntraDay
- VectorVest AutoTester
- VectorVest Educational Services
- VectorVest OnLine
- VectorVest Options Analyzer
- VectorVest ProGraphics v6.0
- VectorVest ProTrader 7
- VectorVest RealTime Derby Tool
- VectorVest Simulator
- VectorVest Variator
- VectorVest Watchdog