HOT TOPICS LIST
- MACD
- Fibonacci
- RSI
- Gann
- ADXR
- Stochastics
- Volume
- Triangles
- Futures
- Cycles
- Volatility
- ZIGZAG
- MESA
- Retracement
- Aroon
INDICATORS LIST
LIST OF TOPICS
PRINT THIS ARTICLE
by Donald W. Pendergast, Jr.
It takes patience to identify and wait for divergence situations to play out, but the process can be worthwhile for committed traders.
Position: N/A
Donald W. Pendergast, Jr.
Donald W. Pendergast is a financial markets consultant who offers specialized services to stock brokers and high net worth individuals who seek a better bottom line for their portfolios.
PRINT THIS ARTICLE
CHART ANALYSIS
IWM Looking For Intraday Divergences
05/22/12 09:31:48 AMby Donald W. Pendergast, Jr.
It takes patience to identify and wait for divergence situations to play out, but the process can be worthwhile for committed traders.
Position: N/A
| Daytraders (and swing traders who use intraday price bars to initiate their trades) use a variety of methods and systems to help them identify what they perceive to be low-risk, high-probability trading opportunities. Here's a look at a way to help spot divergences on a five-minute time frame in a stock index exchange traded fund (ETF). |

|
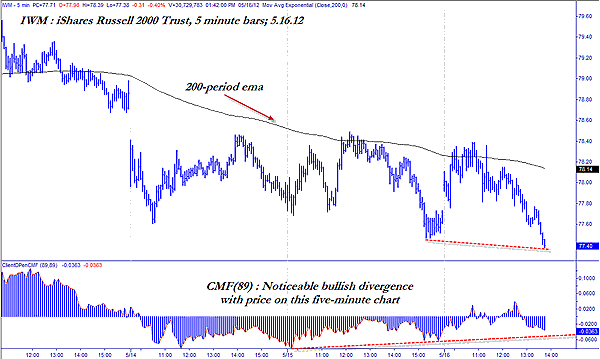
| FIGURE 1: IWM, FIVE-MINUTE. The very bearish posture of this five-minute chart of IWM is mitigated by the bullish price/money flow divergence that has manifested. |
| Graphic provided by: TradeStation. |
| |
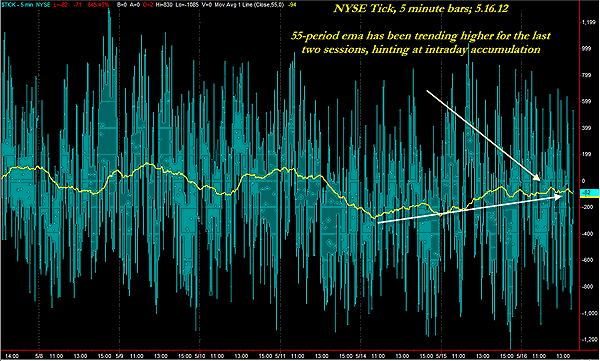
| Perhaps you already rely on (and hopefully profit from) an intraday trading method for stocks, forex, ETFs, or even futures contracts, but you want to cut down on the kinds of losing trades that tend to happen near major daily and/or intraday reversal points, particularly if you use a trend-following method or system. How might a serious trader set about to do that? One way to do this might be to open up a five-minute chart (or one of the time frames you prefer). In this example, we'll use one of IWM (Figure 1), the Russell 2000 index ETF, and apply an 89-period Chaikin money flow histogram (CMF)(89) and a 200-period exponential moving average (EMA). The chart is based on the price action of the normal daily session hours of 930 to 1600 ET. Note that even though the 200-period EMA is still trending lower, the money flow histogram is suggesting that steady accumulation has been under way since the morning of May 15, 2012. IWM made an intraday low on the early afternoon of May 16 at 77.31 and is currently trading near 77.40. The next chart you may want to bring up is one of the NYSE tick ($TICK) (Figure 2); setting it to a five-minute bar and overlaying a 55-period EMA should give you a chart just like this one. Even as the bullish divergence on the upper chart was developing, the trend of the 55-period EMA on the tick chart was also trending higher, which is yet another sign of accumulation occurring in the broad market. Now, of course, if you trade IWM on a five-minute time frame, simply having some evidence that accumulation is taking place is not enough to warrant a new long entry in and of itself. However, if you get a fresh short signal from your system, you may want to be prepared (and also use smaller positions than normal) just in case a short-covering rally erupts, keeping your losses smaller than usual. At the same time, new long signals from your system might be embraced with a bit more enthusiasm, particularly if it's an intraday trend-following method that only enters on strength. Knowing that the bullish divergence has been confirmed might give you the added confidence that you'll need in order to stay with a trend-following system. As anyone who trades these kinds of systems can attest, the qualiites of patience and perseverance are mandatory, not optional. |

|
| FIGURE 2: TICK, FIVE-MINUTE. The trend of the five-minute NYSE tick chart has been slightly bullish for the past two sessions, thus helping to confirm the bullish money flow divergence. |
| Graphic provided by: TradeStation. |
| |
| There are other methods that could enhance this particular analysis technique. Some other useful technical analysis tools might include: 1. Confirming simultaneous price /money flow divergences on a five-, 20-, and 60-minute charts in the market you trade. 2. Identifying the times/prices when multicycle lows are expected to occur in those same time frames. If you can add that kind of analysis output into your trading regimen, it might make it much easier to stay with the signals your proven mechanical intraday trading system sends your way every single day. The broad US markets have experienced a notable correction over the past few weeks, but they may be due for a tradable bounce soon, and if that potential bounce setup manifests soon, it could be a great time to put the analysis concepts described in this article to good use. |
Donald W. Pendergast is a financial markets consultant who offers specialized services to stock brokers and high net worth individuals who seek a better bottom line for their portfolios.
| Title: | Writer, market consultant |
| Company: | Linear Trading Systems LLC |
| Jacksonville, FL 32217 | |
| Phone # for sales: | 904-239-9564 |
| E-mail address: | lineartradingsys@gmail.com |
Traders' Resource Links | |
| Linear Trading Systems LLC has not added any product or service information to TRADERS' RESOURCE. | |
Click here for more information about our publications!
PRINT THIS ARTICLE

Request Information From Our Sponsors
- StockCharts.com, Inc.
- Candle Patterns
- Candlestick Charting Explained
- Intermarket Technical Analysis
- John Murphy on Chart Analysis
- John Murphy's Chart Pattern Recognition
- John Murphy's Market Message
- MurphyExplainsMarketAnalysis-Intermarket Analysis
- MurphyExplainsMarketAnalysis-Visual Analysis
- StockCharts.com
- Technical Analysis of the Financial Markets
- The Visual Investor
- VectorVest, Inc.
- Executive Premier Workshop
- One-Day Options Course
- OptionsPro
- Retirement Income Workshop
- Sure-Fire Trading Systems (VectorVest, Inc.)
- Trading as a Business Workshop
- VectorVest 7 EOD
- VectorVest 7 RealTime/IntraDay
- VectorVest AutoTester
- VectorVest Educational Services
- VectorVest OnLine
- VectorVest Options Analyzer
- VectorVest ProGraphics v6.0
- VectorVest ProTrader 7
- VectorVest RealTime Derby Tool
- VectorVest Simulator
- VectorVest Variator
- VectorVest Watchdog
