HOT TOPICS LIST
- MACD
- Fibonacci
- RSI
- Gann
- ADXR
- Stochastics
- Volume
- Triangles
- Futures
- Cycles
- Volatility
- ZIGZAG
- MESA
- Retracement
- Aroon
INDICATORS LIST
LIST OF TOPICS
PRINT THIS ARTICLE
by Donald W. Pendergast, Jr.
Still in a trading range, will the latest RMO sell signal in shares of Berkshire-Hathaway B lead to a tradable decline?
Position: N/A
Donald W. Pendergast, Jr.
Donald W. Pendergast is a financial markets consultant who offers specialized services to stock brokers and high net worth individuals who seek a better bottom line for their portfolios.
PRINT THIS ARTICLE
CYCLES
BRKB Breaking Badly?
05/21/12 08:07:49 AMby Donald W. Pendergast, Jr.
Still in a trading range, will the latest RMO sell signal in shares of Berkshire-Hathaway B lead to a tradable decline?
Position: N/A
| Warren Buffett and his crew at Berkshire Hathaway (BRKB) are regarded as some of the most successful value investors of the post-WWII period, blessed as they are with the gift of locating excellent long-term equity investment opportunities. However, no matter how good an investment manager or trader is at trading, eventually they are going to experience a drawdown -- which is what we may be about to witness in shares of BRKB. Here's a closer look now. |

|
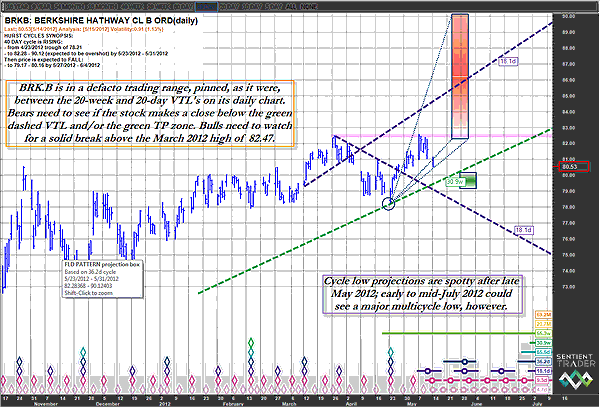
| FIGURE 1: BRKB, DAILY. Which way now, BRKB? The stock is trading in a well-defined range, but a daily close above the pink horizontal line or the green dashed VTL might be sufficient warning to its new trend direction. |
| Graphic provided by: Sentient Trader. |
| |
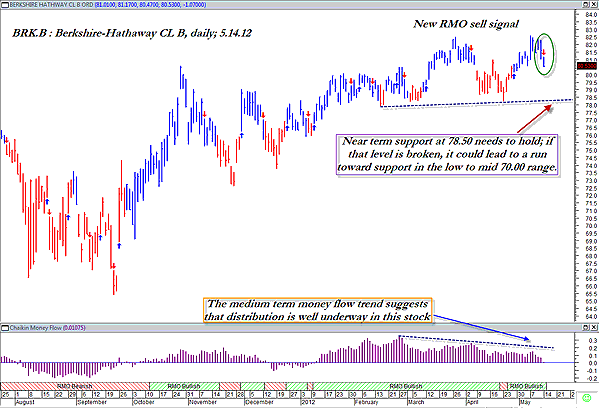
| In Figure 1, we will examine is the Sentient Trader daily chart for BRKB; according to a technical/cycles concept known as a valid trendline (VTL for short). We find that BRKB is trading in between the 20-week VTL (dashed green line) and the upper extended 20-day VTL (dark blue dashed line); this is telling us that until the stock manages a daily close below the 20-week VTL, it is likely to remain in a trading range, especially if BRKB keeps trading below the March 2012 high of 82.47 (see pink shaded horizontal line). Any break above that might mean a run higher into the red shaded time/price projection box, which is suggesting a possible maximum cycle high of 90.12 by May 31, 2012. Conversely, the green time/projection box is suggesting a maximum cycle low of 79.17 by June 4, 2012. Which one is correct? Only Mr. Market knows the answer to that question, but as we glance at our next chart, we are given a few clues to suggest that BRKB may be soon "breaking bad" -- and in a meaningful way, possibly down to support in the 78.00 to 78.50 level, perhaps sooner rather than later. For starters, notice the steady deterioration in the medium-term money flow trend (based on the 34-period Chaikin money flow histogram [CMF][34]), which has also manifested as a bearish price/money flow divergence. When the money flow in a stock is weakening even as the stock is trending higher (or even in a trading range), it's usually an early warning of an upcoming correction of some sort. Second, the RMO (Rahul Mohindar) trading system from MetaStock 11 has just fired a new short signal in BRKB, and, as the signal comes in the wake of a failed attempt to take out the March 2012 high of 82.47, perhaps the stock has already set its sights on that strong support level depicted on the chart. Again, it's near 78.00 to 78.50, and many investors and traders will be watching to see if that level holds -- or if it doesn't. See Figure 2. |

|
| FIGURE 2: BRKB, DAILY. The steadily declining money flow trend in BRKB suggests that any new rally attempt will have a hard time gaining traction. Conversely, new sell signals might incur even more selling pressure. |
| Graphic provided by: MetaStock. |
| Graphic provided by: RMO trading system indicators from MetaStock 11. |
| |
| Playing BRKB on the short side here might involve nothing more complicated than buying some slightly in-the-money puts, using Monday's high of 81.20 as an initial stop and a price target of 79.00. In other words, a quick "in and out" kind of long put play will quickly prove that you're a genius or something a bit less savvy. But however you choose to play it, be sure to limit your risk to no more than 1% to 2% of your total equity account value, so that no matter what happens, you can come back to the market and play again. |
Donald W. Pendergast is a financial markets consultant who offers specialized services to stock brokers and high net worth individuals who seek a better bottom line for their portfolios.
| Title: | Writer, market consultant |
| Company: | Linear Trading Systems LLC |
| Jacksonville, FL 32217 | |
| Phone # for sales: | 904-239-9564 |
| E-mail address: | lineartradingsys@gmail.com |
Traders' Resource Links | |
| Linear Trading Systems LLC has not added any product or service information to TRADERS' RESOURCE. | |
Click here for more information about our publications!
PRINT THIS ARTICLE

Request Information From Our Sponsors
- StockCharts.com, Inc.
- Candle Patterns
- Candlestick Charting Explained
- Intermarket Technical Analysis
- John Murphy on Chart Analysis
- John Murphy's Chart Pattern Recognition
- John Murphy's Market Message
- MurphyExplainsMarketAnalysis-Intermarket Analysis
- MurphyExplainsMarketAnalysis-Visual Analysis
- StockCharts.com
- Technical Analysis of the Financial Markets
- The Visual Investor
- VectorVest, Inc.
- Executive Premier Workshop
- One-Day Options Course
- OptionsPro
- Retirement Income Workshop
- Sure-Fire Trading Systems (VectorVest, Inc.)
- Trading as a Business Workshop
- VectorVest 7 EOD
- VectorVest 7 RealTime/IntraDay
- VectorVest AutoTester
- VectorVest Educational Services
- VectorVest OnLine
- VectorVest Options Analyzer
- VectorVest ProGraphics v6.0
- VectorVest ProTrader 7
- VectorVest RealTime Derby Tool
- VectorVest Simulator
- VectorVest Variator
- VectorVest Watchdog
