HOT TOPICS LIST
- MACD
- Fibonacci
- RSI
- Gann
- ADXR
- Stochastics
- Volume
- Triangles
- Futures
- Cycles
- Volatility
- ZIGZAG
- MESA
- Retracement
- Aroon
INDICATORS LIST
LIST OF TOPICS
PRINT THIS ARTICLE
by Koos van der Merwe
Old Dominion Freight Line has given me an RSI buy signal. Should we buy the stock now?
Position: Accumulate
Koos van der Merwe
Has been a technical analyst since 1969, and has worked as a futures and options trader with First Financial Futures in Johannesburg, South Africa.
PRINT THIS ARTICLE
ELLIOTT WAVE
An Old Dominion Freight Line Buy Signal?
05/21/12 09:04:38 AMby Koos van der Merwe
Old Dominion Freight Line has given me an RSI buy signal. Should we buy the stock now?
Position: Accumulate
| Forbes magazine called Old Dominion Freight Line (ODFL) one of the US's 100 most trustworthy companies (5/11/12), so at what price should we start buying it? To help us with that decision, we must look at both a weekly chart and a daily chart. |

|
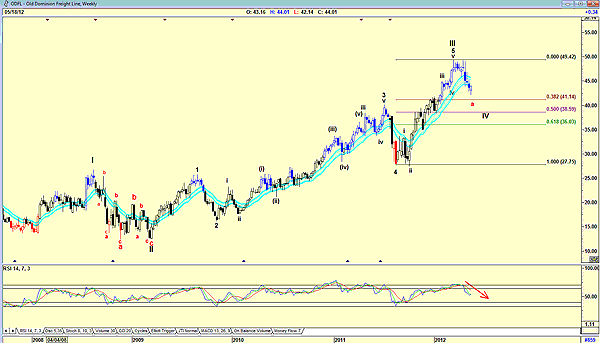
| FIGURE 1: ODFL, WEEKLY |
| Graphic provided by: AdvancedGET. |
| |
| In Figure 1, the weekly chart, I am suggesting that the pattern is in a wave IV Elliott wave correction. The bottom could be a wave a of an abc correction and the Fibonacci retracement is suggesting a 38.2% correction of the wave 5 rise of wave III at $41.14. Now, the problem with this assumption is that the correction should be within the fourth wave of lesser degree, which means that the 50% retracement level of $38.59 looks more likely. The relative strength index (RSI), which is falling, is confirming this assumption. Finally, we must ask, is wave II a complicated or simple wave? Looking at it, it looks extremely complicated, which means that wave IV should be a simple correction, suggesting a simple move down to the 50% retracement level. Of course, it could fall to $36.03, the 68.2% level, so we would watch to see if it holds at $38.59. |

|
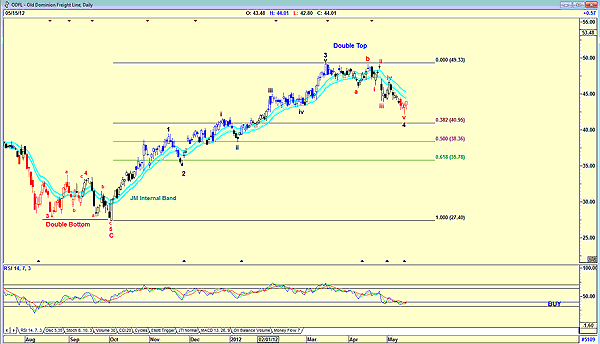
| FIGURE 2: ODFL, DAILY |
| Graphic provided by: AdvancedGET. |
| |
| The daily chart in Figure 2 has the RSI suggesting a buy. The Elliott wave count on the chart is suggesting the completion of a wave 4 correction, and a rise into wave 5; however, the 38.2% correction of $40.95 has not been reached, which puts doubt in our minds. In addition, the XTL trend indicator, where the color of the candlestick is still red, is also suggesting that it is not yet time to buy. Investors could wait until the price breaks above the upper JM internal band line. Old Dominion Freight Line is definitely a share that should be on our watchlist for a future buy. |
Has been a technical analyst since 1969, and has worked as a futures and options trader with First Financial Futures in Johannesburg, South Africa.
| Address: | 3256 West 24th Ave |
| Vancouver, BC | |
| Phone # for sales: | 6042634214 |
| E-mail address: | petroosp@gmail.com |
Click here for more information about our publications!
PRINT THIS ARTICLE

Request Information From Our Sponsors
- StockCharts.com, Inc.
- Candle Patterns
- Candlestick Charting Explained
- Intermarket Technical Analysis
- John Murphy on Chart Analysis
- John Murphy's Chart Pattern Recognition
- John Murphy's Market Message
- MurphyExplainsMarketAnalysis-Intermarket Analysis
- MurphyExplainsMarketAnalysis-Visual Analysis
- StockCharts.com
- Technical Analysis of the Financial Markets
- The Visual Investor
- VectorVest, Inc.
- Executive Premier Workshop
- One-Day Options Course
- OptionsPro
- Retirement Income Workshop
- Sure-Fire Trading Systems (VectorVest, Inc.)
- Trading as a Business Workshop
- VectorVest 7 EOD
- VectorVest 7 RealTime/IntraDay
- VectorVest AutoTester
- VectorVest Educational Services
- VectorVest OnLine
- VectorVest Options Analyzer
- VectorVest ProGraphics v6.0
- VectorVest ProTrader 7
- VectorVest RealTime Derby Tool
- VectorVest Simulator
- VectorVest Variator
- VectorVest Watchdog
