HOT TOPICS LIST
- MACD
- Fibonacci
- RSI
- Gann
- ADXR
- Stochastics
- Volume
- Triangles
- Futures
- Cycles
- Volatility
- ZIGZAG
- MESA
- Retracement
- Aroon
INDICATORS LIST
LIST OF TOPICS
PRINT THIS ARTICLE
by Mike Carr, CMT
Broad market indexes are weaker than the headline indexes, a condition that has preceded market declines in the past.
Position: Sell
Mike Carr, CMT
Mike Carr, CMT, is a member of the Market Technicians Association, and editor of the MTA's newsletter, Technically Speaking. He is also the author of "Smarter Investing in Any Economy: The Definitive Guide to Relative Strength Investing," and "Conquering the Divide: How to Use Economic Indicators to Catch Stock Market Trends."
PRINT THIS ARTICLE
DIVERGENCE INDEX
Index Divergences Pointing To Potential Market Drop
05/18/12 08:21:57 AMby Mike Carr, CMT
Broad market indexes are weaker than the headline indexes, a condition that has preceded market declines in the past.
Position: Sell
| Many individuals and traders follow the Dow Jones Industrial Average (DJIA), the Standard & Poor's 500, and the NASDAQ Composite Index. These indexes are highly correlated with each other and the performance of each is dominated by large-cap stocks. Individual investors often believe that these indexes closely track the performance of their retirement accounts, and the indexes are useful for long-term buy & hold investors who use index funds in their portfolio. While the indexes may track the performance of the average investor, they do not necessarily reflect the performance of the average stock. To track the average stock, traders have turned to breadth indicators. These indicators, which include the advance-decline line and a number of indicators based on that data, are used by some traders to confirm price trends or spot divergences. |
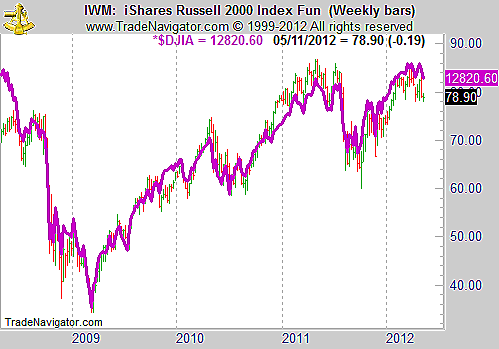
| Broader stock market indexes can also be used to gain insight into how the average stock is performing and confirm trends or highlight divergences. The Russell indexes are broader than the indexes usually found in headlines. Although these indexes contain more stocks than the more popular ones, the price moves of both do have a high degree of correlation. An exchange traded fund (ETF) that tracks the small-cap Russell 2000 index (IWM) is plotted in Figure 1, with the closing prices of the DJIA overlaid on the chart. The trends are similar and divergences seem to be insignificant. Weekly prices are shown in the chart, but monthly and daily charts show similar patterns. |

|
| FIGURE 1: RUSSELL 2000, WEEKLY. The Russell 2000 small-cap index seems to closely track the large-cap DJIA. |
| Graphic provided by: Trade Navigator. |
| |
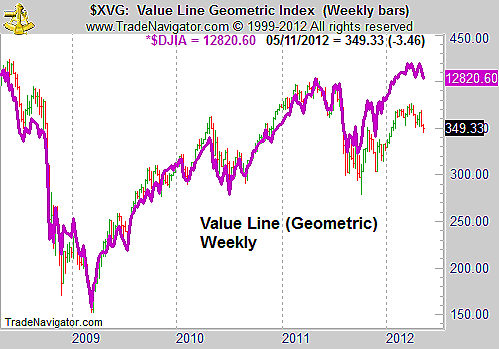
| Less widely followed is the Value Line Geometric Index ($XVG). This index uses a geometric average in its calculation. Many analysts believe that geometric averages have a downward bias because of the way they are calculated. The weekly chart of the Value Line Index with the DJIA overlaid is shown in Figure 2. |

|
| FIGURE 2: VALUE LINE, WEEKLY. XVG shows a tendency to move in line with DJIA most of the time. |
| Graphic provided by: Trade Navigator. |
| |
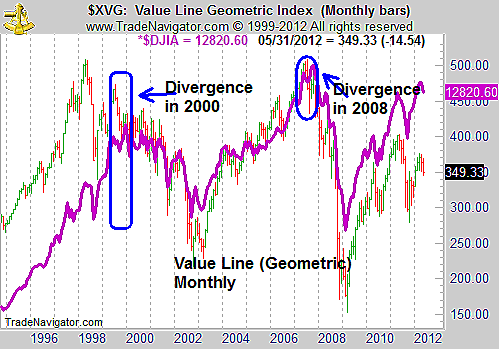
| A monthly chart of $XVG is shown in Figure 3 in order to show the divergences that developed before major market declines. Bearish divergences occur when the DJIA reaches a new high, but $XVG does not reach a new high. This happened in 2000 and in 2008. Significant declines in all indexes followed. The same type of divergence has developed in the market now. |

|
| FIGURE 3: VALUE LINE, MONTHLY. XVG is signaling that caution is warranted in stocks. |
| Graphic provided by: Trade Navigator. |
| |
| There is some value in looking at market data from unique perspectives. Geometric averages are not as widely used as simple moving averages or exponential moving averages. That is one reason the Value Line Index could have some value. Another is that it includes about 1,600 stocks and represents a broader perspective than commonly followed indexes. Most of the time, the Value Line is confirming the trend of other market averages. In rare instances, there will be a divergence. These have historically been resolved in the direction indicated by the Value Line. There are not enough of these divergences to develop a statistically significant conclusion, but traders should pay attention to this setup when it occurs. At this time, it is one of several indicators pointing to a market decline. Aggressive traders should start initiating shorts, while more conservative traders should wait for the index or stock they are trading to break down. All traders should consider taking smaller positions on the long side. |
Mike Carr, CMT, is a member of the Market Technicians Association, and editor of the MTA's newsletter, Technically Speaking. He is also the author of "Smarter Investing in Any Economy: The Definitive Guide to Relative Strength Investing," and "Conquering the Divide: How to Use Economic Indicators to Catch Stock Market Trends."
| Website: | www.moneynews.com/blogs/MichaelCarr/id-73 |
| E-mail address: | marketstrategist@gmail.com |
Click here for more information about our publications!
Comments

Request Information From Our Sponsors
- StockCharts.com, Inc.
- Candle Patterns
- Candlestick Charting Explained
- Intermarket Technical Analysis
- John Murphy on Chart Analysis
- John Murphy's Chart Pattern Recognition
- John Murphy's Market Message
- MurphyExplainsMarketAnalysis-Intermarket Analysis
- MurphyExplainsMarketAnalysis-Visual Analysis
- StockCharts.com
- Technical Analysis of the Financial Markets
- The Visual Investor
- VectorVest, Inc.
- Executive Premier Workshop
- One-Day Options Course
- OptionsPro
- Retirement Income Workshop
- Sure-Fire Trading Systems (VectorVest, Inc.)
- Trading as a Business Workshop
- VectorVest 7 EOD
- VectorVest 7 RealTime/IntraDay
- VectorVest AutoTester
- VectorVest Educational Services
- VectorVest OnLine
- VectorVest Options Analyzer
- VectorVest ProGraphics v6.0
- VectorVest ProTrader 7
- VectorVest RealTime Derby Tool
- VectorVest Simulator
- VectorVest Variator
- VectorVest Watchdog
