HOT TOPICS LIST
- MACD
- Fibonacci
- RSI
- Gann
- ADXR
- Stochastics
- Volume
- Triangles
- Futures
- Cycles
- Volatility
- ZIGZAG
- MESA
- Retracement
- Aroon
INDICATORS LIST
LIST OF TOPICS
PRINT THIS ARTICLE
by Donald W. Pendergast, Jr.
Keeping intraday tabs on stocks that are making substantial gains or losses may help active traders seize opportunities in real-time.
Position: N/A
Donald W. Pendergast, Jr.
Donald W. Pendergast is a financial markets consultant who offers specialized services to stock brokers and high net worth individuals who seek a better bottom line for their portfolios.
PRINT THIS ARTICLE
STRATEGIES
Looking For Big Intraday Decliners
05/17/12 08:20:46 AMby Donald W. Pendergast, Jr.
Keeping intraday tabs on stocks that are making substantial gains or losses may help active traders seize opportunities in real-time.
Position: N/A
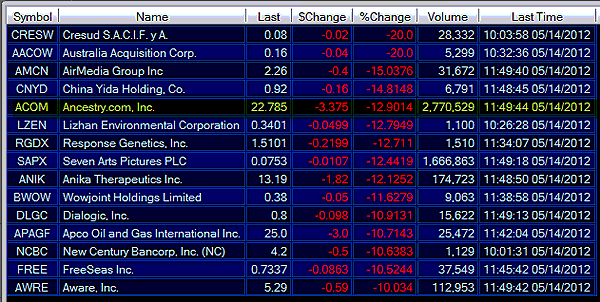
| Scanning or screening for intraday stocks making big moves isn't a new conceept; daytraders have been doing this since the late 1980s, albeit with far fewer sophisticated trading platforms than we now have available today. Here's how to scan for a list of the largest percentage declining stocks using the ActiveTick software platform. See Figure 1. |

|
| FIGURE 1: DECLINERS. The largest NASDAQ percentage decliners during the morning trading session of May 14, 2012. |
| Graphic provided by: Activetick.com. |
| |
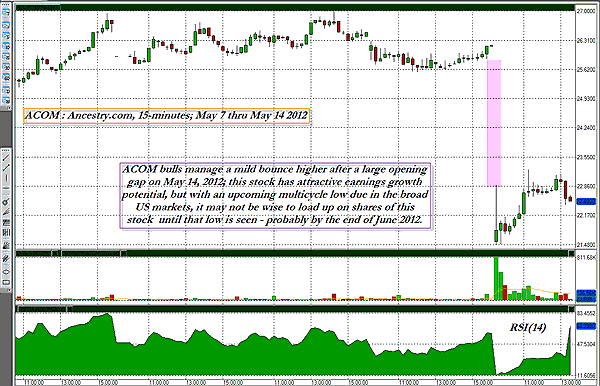
| ActiveTick is a very useful charting/trading/scanning/analysis software platform that runs on your PC or laptop, and it can be a cost-effective way for active traders to home in on the stocks that are exhibiting the kind of price momentum action that they seek. In this example, I've opened the platform and selected the top market movers icon from the overhead toolbar on the screen. I then decided to scan for a list of NASDAQ stocks making the largest percent movers lower (at around 1142 ET on May 14, 2012); the on-screen tabs and workflow make it easy to select from US stocks on the NYSE, AMEX, NASDAQ, OTC, and Canadian stocks on the Toronto and Venture exchanges, respectively. It only takes a moment for the scan results to appear; one NASDAQ stock that caught my attention was Ancestry.com (ACOM), as it was down by more than 12% with nearly three million shares trading hands in the issue before noon on May 14, 2012. Using a simple series of right-clicks, I was able to select a 15-minute intraday chart of ACOM, one that clearly shows a huge gap lower at the opening of Monday's trading session. Moving to the chart tab, I was then able to add a 14-period relative strength index (RSI) histogram in a new window; I also changed the default bar chart to a candlestick style chart. ActiveTick allows a trader/analyst a tremendous amount of tweaking room, as all indicators (it comes standard with nearly four dozen technical studies, ranging from the absolute price oscillator to Williams %R), line studies, and charting window parameters offer a range of potential settings from which to choose. The platform also can be configured to enable live trading in a brokerage account; at the moment, the brokers that can be linked to ActiveTick include TD Ameritrade, FXCM, and Gain Capital Forex. Virtual (paper trading) accounts can also be created within the platform, a nice feature for traders wishing to test their automated strategies or discretionary trading prowess. See Figure 2. |

|
| FIGURE 2: ACOM, 15-MINUTE. Shares of Ancestry.com manage a modest bounce after a large bearish opening gap. The stock may yet need to test major support again near 20.75 before any sustained rally can commence, however. |
| Graphic provided by: Activetick.com. |
| |
| So is this morning gap lower in ACOM a precursor to more downside action, especially over the next six weeks or so as the broad US markets are anticipated to bottom out? Or might this be a good place for contrarians to add a few more shares, in hopes of seeing substantially higher prices by year-end? Only the market knows for sure, but by using real-time scanning tools, you'll always know which stocks are moving strongly higher or lower. Currently, ACOM's long-term money flow (based on the 100-period Chaikin money flow histogram (CMF)(100)) is still positive but isn't too far above its zero line, and it's possible that the stock's major support area between 20.67 and 20.75 is going to be tested once again -- probably sooner than later -- especially if the further drawdown of the US stock indexes is still ahead for the remainder of May and on into June 2012. So use scanning tools to locate the stocks that are moving and then apply your best systems to them to be ready to pounce once they fire a signal; but only do so after you check out the big picture on your daily and weekly charts, too. |
Donald W. Pendergast is a financial markets consultant who offers specialized services to stock brokers and high net worth individuals who seek a better bottom line for their portfolios.
| Title: | Writer, market consultant |
| Company: | Linear Trading Systems LLC |
| Jacksonville, FL 32217 | |
| Phone # for sales: | 904-239-9564 |
| E-mail address: | lineartradingsys@gmail.com |
Traders' Resource Links | |
| Linear Trading Systems LLC has not added any product or service information to TRADERS' RESOURCE. | |
Click here for more information about our publications!
Comments

Request Information From Our Sponsors
- StockCharts.com, Inc.
- Candle Patterns
- Candlestick Charting Explained
- Intermarket Technical Analysis
- John Murphy on Chart Analysis
- John Murphy's Chart Pattern Recognition
- John Murphy's Market Message
- MurphyExplainsMarketAnalysis-Intermarket Analysis
- MurphyExplainsMarketAnalysis-Visual Analysis
- StockCharts.com
- Technical Analysis of the Financial Markets
- The Visual Investor
- VectorVest, Inc.
- Executive Premier Workshop
- One-Day Options Course
- OptionsPro
- Retirement Income Workshop
- Sure-Fire Trading Systems (VectorVest, Inc.)
- Trading as a Business Workshop
- VectorVest 7 EOD
- VectorVest 7 RealTime/IntraDay
- VectorVest AutoTester
- VectorVest Educational Services
- VectorVest OnLine
- VectorVest Options Analyzer
- VectorVest ProGraphics v6.0
- VectorVest ProTrader 7
- VectorVest RealTime Derby Tool
- VectorVest Simulator
- VectorVest Variator
- VectorVest Watchdog
