HOT TOPICS LIST
- MACD
- Fibonacci
- RSI
- Gann
- ADXR
- Stochastics
- Volume
- Triangles
- Futures
- Cycles
- Volatility
- ZIGZAG
- MESA
- Retracement
- Aroon
INDICATORS LIST
LIST OF TOPICS
PRINT THIS ARTICLE
by Chaitali Mohile
Is the bearish range-bound price action and breaching of the support line highlighting bearish days for the gold spot price?
Position: Sell
Chaitali Mohile
Active trader in the Indian stock markets since 2003 and a full-time writer. Trading is largely based upon technical analysis.
PRINT THIS ARTICLE
TECHNICAL ANALYSIS
Has Gold Turned Bearish?
05/17/12 11:52:42 AMby Chaitali Mohile
Is the bearish range-bound price action and breaching of the support line highlighting bearish days for the gold spot price?
Position: Sell
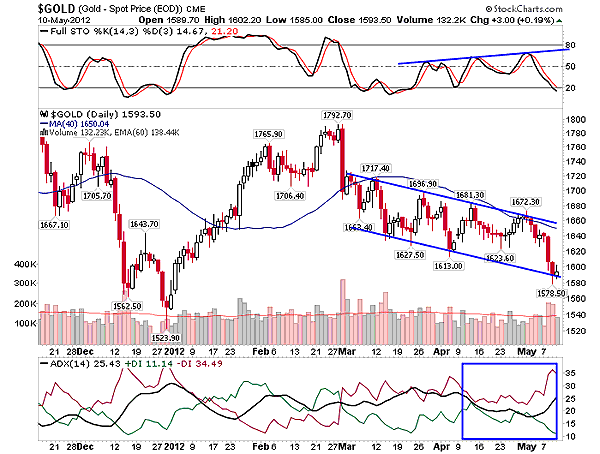
| In the past two months, the spot price of gold ($GOLD) has been forming a series of lower highs and lows. The trading range is wide, enabling easy and safe trades. But the lower top and bottom have formed a short-term descending channel on the daily time frame chart in Figure 1. Neither of the two trendlines of the channel is breached. The price is perfectly zigzagging within the channel. The rally from the lower trendline support gave a short-term buying opportunity for traders and a short sell is triggered near an upper trendline resistance. |

|
| FIGURE 1: $GOLD, DAILY |
| Graphic provided by: StockCharts.com. |
| |
| The average directional index (ADX) (14) is completely engulfed by the bears. A downtrend is showing a robust bearish force, which may pull down the rally even more. However, the full stochastic (14,3,3) has formed a positive divergence, suggesting a pullback rally within the descending channel. In considering the previous upward price movement from trendline support, traders can trigger long positions from the current level. Although small buying and selling opportunities for $GOLD can be grabbed, the descending channel is itself a bearish formation. The index could continue to remain weak. |
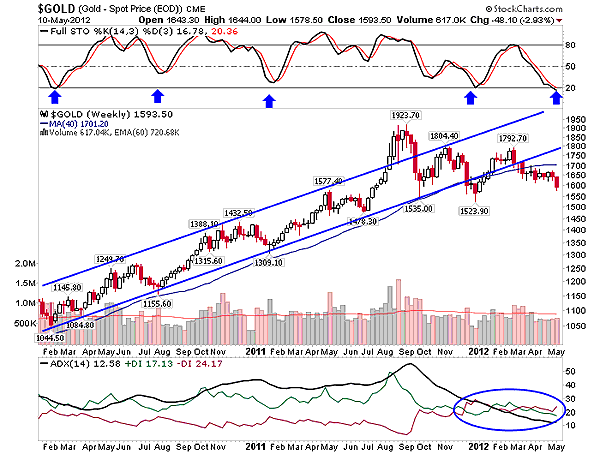
| The bullish rally in $GOLD has formed a long-term ascending channel on the weekly time frame chart in Figure 2. The index has been steadily climbing to higher levels on the price chart. An upper trendline resistance was once violated by the price rally. However, the bullish breakout in Figure 2 could not sustain above the newly formed trendline support. An overheated uptrend at 60 levels discouraged the bullish breakout, and as a result, $GOLD plunged back into its ascending channel. The failed breakout and the overheated uptrend were the major reversal signals in Figure 2. |

|
| FIGURE 2: $GOLD, WEEKLY |
| Graphic provided by: StockCharts.com. |
| |
| Later, $GOLD challenged the lower trendline and the 50-day moving average (MA) support (that was untouched for the past two years). Eventually, the ascending channel as well as the 50-day MA support broke downward. The index has witnessed a robust bearish breakout due to an overheated uptrend. The ADX (14) descended much below the 15 levels, weakening the trend. Currently, the trend is directionless and the buying and selling pressures are equally low. The blue arrows on the stochastic oscillator show that the indicator has surged from the oversold region; it has never slipped below the 20 levels. If we anticipate that $GOLD would follow a similar pattern and initiate an ascending move, the 50-day MA resistance would terminate the relief rally. |
| In such a scenario, $GOLD would tumble towards its next immediate support at 1535 and 1523 levels. These two are the major support levels for the index, and hence, the descending rally must establish support here. However, price movement near 1535 and 1523 should be observed carefully before posting any trades. Just for ready reference, the uptrend on the monthly time chart is highly overheated and is reversing. $GOLD is likely to remain weak for the next few weeks. |
Active trader in the Indian stock markets since 2003 and a full-time writer. Trading is largely based upon technical analysis.
| Company: | Independent |
| Address: | C1/3 Parth Indraprasth Towers. Vastrapur |
| Ahmedabad, Guj 380015 | |
| E-mail address: | chaitalimohile@yahoo.co.in |
Traders' Resource Links | |
| Independent has not added any product or service information to TRADERS' RESOURCE. | |
Click here for more information about our publications!
PRINT THIS ARTICLE

Request Information From Our Sponsors
- StockCharts.com, Inc.
- Candle Patterns
- Candlestick Charting Explained
- Intermarket Technical Analysis
- John Murphy on Chart Analysis
- John Murphy's Chart Pattern Recognition
- John Murphy's Market Message
- MurphyExplainsMarketAnalysis-Intermarket Analysis
- MurphyExplainsMarketAnalysis-Visual Analysis
- StockCharts.com
- Technical Analysis of the Financial Markets
- The Visual Investor
- VectorVest, Inc.
- Executive Premier Workshop
- One-Day Options Course
- OptionsPro
- Retirement Income Workshop
- Sure-Fire Trading Systems (VectorVest, Inc.)
- Trading as a Business Workshop
- VectorVest 7 EOD
- VectorVest 7 RealTime/IntraDay
- VectorVest AutoTester
- VectorVest Educational Services
- VectorVest OnLine
- VectorVest Options Analyzer
- VectorVest ProGraphics v6.0
- VectorVest ProTrader 7
- VectorVest RealTime Derby Tool
- VectorVest Simulator
- VectorVest Variator
- VectorVest Watchdog
