HOT TOPICS LIST
- MACD
- Fibonacci
- RSI
- Gann
- ADXR
- Stochastics
- Volume
- Triangles
- Futures
- Cycles
- Volatility
- ZIGZAG
- MESA
- Retracement
- Aroon
INDICATORS LIST
LIST OF TOPICS
PRINT THIS ARTICLE
by Donald W. Pendergast, Jr.
Many traders like to buy pullbacks and/or sell into strength, and TradeStation's Scanner may have just the tool for these end-of day traders.
Position: N/A
Donald W. Pendergast, Jr.
Donald W. Pendergast is a financial markets consultant who offers specialized services to stock brokers and high net worth individuals who seek a better bottom line for their portfolios.
PRINT THIS ARTICLE
Scanning For Oversold Stocks
05/16/12 09:59:18 AMby Donald W. Pendergast, Jr.
Many traders like to buy pullbacks and/or sell into strength, and TradeStation's Scanner may have just the tool for these end-of day traders.
Position: N/A
| End-of day (EOD) stock traders don't deal with the market's gyrations as they unfold intraday, and as such, they can make their investing and trading decisions at a more relaxed and leisurely pace after the market closes. However, they are still faced with the sometimes daunting task of searching and screening for stocks that meet a precise set of technical and/or fundamental criteria. In this article, we'll examine a simple, yet effective scanning strategy in TradeStation 9.0 that searches for stocks that are overbought or oversold. Here's a closer look now (see Figure 1). |

|
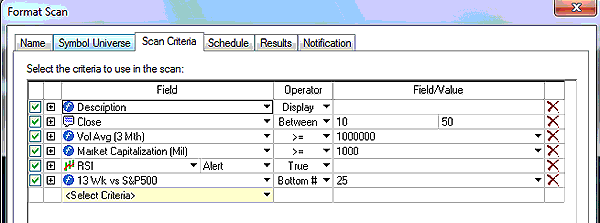
| FIGURE 1: SCAN CRITERIA. The RSI scan criteria can be adjusted according to a trader's preferences. Here, the scan is modified to limit the output to only those NYSE stocks that are underperforming the .SPX over the last 13 weeks. |
| Graphic provided by: TradeStation. |
| |
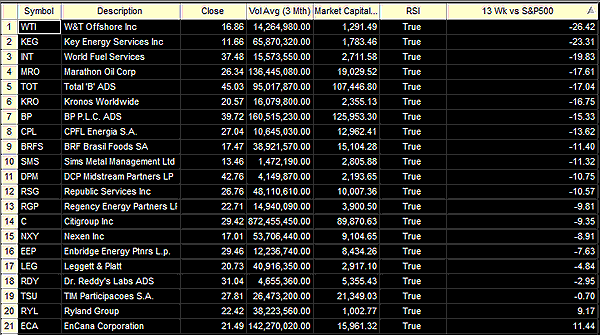
| Simply open the Scanner (the icon is on the left side of the TS 9.0 or higher desktop) and then choose the "RSI" scan from the "Technical" category; then just drag it over to the left side of the scanner window to begin the process of selecting the stock list(s) you want to run through it. In this example, I've chosen to run the NYSE stocks list only, and I've formatted the relative strength index (RSI) scan to a particular set of criteria -- to look for stocks that are weaker than the .SPX over the past 13 weeks and that are also flashing either an RSI oversold or overbought signal. After this minor formatting, I simply pressed run and came up with the following output of stocks (see Figure 2). |

|
| FIGURE 2: STOCK OUTPUT. All of the columns can be resorted with just one click on the column header. |
| Graphic provided by: TradeStation. |
| |
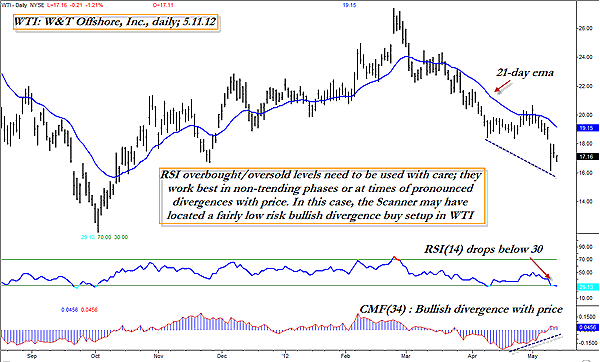
| W&T Offshore (WTI) topped the list, as it had the worst 13-week relative strength versus the .SPX. Opening the daily chart (just right-click on the ticker symbol for the stock and you can easily create a chart for it) for the stock reveals some very interesting technical details: 1. The stock is technically oversold, with an RSI(14) value of 29.13. As this RSI reading is at about the same level as seen at the previous oversold event, even though the stock has dropped in value, this is indicative that some minor accumulation may be taking place. 2. The 34-period Chaikin money flow is manifesting a bullish-looking divergence pattern, even as the stock was still falling. Once again, it's a clear sign that some sort of accumulation may be under way in this stock. Obviously, it might be premature to place a buy order on WTI without a buy signal from a proven trading system, but at least the RSI overbought/oversold scan can afford traders a rational way to identify when a stock may be approaching a selling exhaustion signal prior to a tradable turn higher. See Figure 3. |

|
| FIGURE 3: WTI, DAILY. Using the RSI as an overbought/oversold indicator works best in trading range markets, but the indicator is also very useful in identifying price/momentum divergence setups, too. |
| Graphic provided by: TradeStation. |
| |
| One way to play WTI here might be to sell near-term, out-of-the-money put options, especially if the stock starts to rise again on heavy volume. If WTI can rise high enough to reach its 21-period EMA (blue line), it could enable some fast profits on a modest short-covering rally. On the downside, it would be wise to buy back a short put if it doubles in price and/or you see the 16.15 support level taken out. If either occurs, just buy back the short put and wait for another attractive trade setup to come along -- you probably won't have to wait long. The broad US markets may be ready for another leg down of 3% to 5% over the next few weeks, and this RSI overbought/oversold scan could be a valuable assist to traders looking to do a bit of bottom fishing in the market. |
Donald W. Pendergast is a financial markets consultant who offers specialized services to stock brokers and high net worth individuals who seek a better bottom line for their portfolios.
| Title: | Writer, market consultant |
| Company: | Linear Trading Systems LLC |
| Jacksonville, FL 32217 | |
| Phone # for sales: | 904-239-9564 |
| E-mail address: | lineartradingsys@gmail.com |
Traders' Resource Links | |
| Linear Trading Systems LLC has not added any product or service information to TRADERS' RESOURCE. | |
Click here for more information about our publications!
Comments

Request Information From Our Sponsors
- StockCharts.com, Inc.
- Candle Patterns
- Candlestick Charting Explained
- Intermarket Technical Analysis
- John Murphy on Chart Analysis
- John Murphy's Chart Pattern Recognition
- John Murphy's Market Message
- MurphyExplainsMarketAnalysis-Intermarket Analysis
- MurphyExplainsMarketAnalysis-Visual Analysis
- StockCharts.com
- Technical Analysis of the Financial Markets
- The Visual Investor
- VectorVest, Inc.
- Executive Premier Workshop
- One-Day Options Course
- OptionsPro
- Retirement Income Workshop
- Sure-Fire Trading Systems (VectorVest, Inc.)
- Trading as a Business Workshop
- VectorVest 7 EOD
- VectorVest 7 RealTime/IntraDay
- VectorVest AutoTester
- VectorVest Educational Services
- VectorVest OnLine
- VectorVest Options Analyzer
- VectorVest ProGraphics v6.0
- VectorVest ProTrader 7
- VectorVest RealTime Derby Tool
- VectorVest Simulator
- VectorVest Variator
- VectorVest Watchdog
