

HOT TOPICS LIST
- MACD
- Fibonacci
- RSI
- Gann
- ADXR
- Stochastics
- Volume
- Triangles
- Futures
- Cycles
- Volatility
- ZIGZAG
- MESA
- Retracement
- Aroon
INDICATORS LIST
LIST OF TOPICS
PRINT THIS ARTICLE
by David Penn
A January diamond sent shares of Goldman Sachs up in early March. Another diamond threatens to send those same shares down in June.
Position: N/A
David Penn
Technical Writer for Technical Analysis of STOCKS & COMMODITIES magazine, Working-Money.com, and Traders.com Advantage.
PRINT THIS ARTICLE
CHART ANALYSIS
Goldman Sachs: Diamonds Up and Diamonds Down
06/10/02 08:27:39 AMby David Penn
A January diamond sent shares of Goldman Sachs up in early March. Another diamond threatens to send those same shares down in June.
Position: N/A
| One of the biggest themes in the gold market these days is the role of gold hedging. During gold's terrible swoon from 1996 to 2000, many gold mining companies decided that hedging their gold positions was the only way for many of them to remain solvent. However odd on the surface, gold mining companies who feared massive losses as the gold price fell decided they could cover their losses by, in essence, short selling gold. |
| Many of these companies, as gold prices plummeted in the late 1990s, became virtual hedge funds dedicated, in effect, to keeping gold prices down. But rather than selling gold the way a trader might, many of these companies used firms like Goldman Sachs, JP Morgan and Morgan Stanley Dean Witter to engineer the appropriate set of derivative instruments that would allow these gold mining companies to profit from a falling gold price. Again, given the declines in the price of gold from 1996 until only very recently, it is hard to imagine that such derivatives would have been a difficult sell. |
|
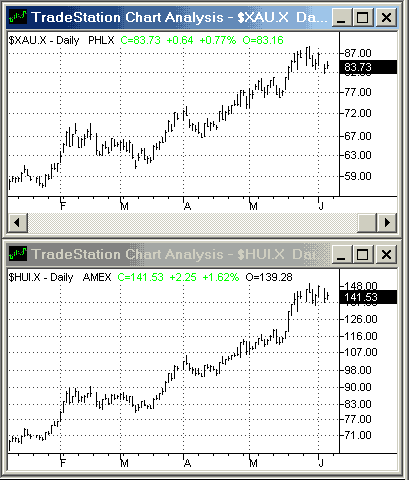
| Figure 1: Hedged is good as the $XAU is up 56% for the year. But the unhedged $HUI, at 113% YTD, is even better. |
| Graphic provided by: TradeStation. |
| |
| The only problem is that, since putting in a bottom in 2000, gold prices have been rising. The Philadelphia Gold and Silver Index ($XAU)--which includes the gold hedgers--is up 56% year-to-date, and the AMEX Gold Bugs Index ($HUI)--which includes the non-hedgers--is up more than twice as much over the same period. To make matters worse, while some hedgers like Newmont Mining (NEM) are reducing the size of their hedge books, some of the derivative engineers actually saw their exposure to (essentially short) hedged positions increase. Given the additional risk financial companies like JP Morgan and Goldman Sachs appear to be taking vis-a-vis the rise in the gold price, I thought it would be interesting to look at how some of these financial stocks are faring. |
| Goldman Sachs (GS) has had some interesting price patterns in 2002. Most notably, this has included a diamond reversal in January-February that stopped a decline in GS that had already taken shares down 20% to start off the year. The diamond reversal looked like a great long opportunity: the bottom of the diamond, for example, was a support area that corresponded with the October 2001 correction low. True to form, shares of GS broke out on the upside in mid-February reaching a peak of 92.25 just before the end of the month. This breakout fell just short of the formation's price target of 93 and, after a brief consolidation, GS began to decline once again. |
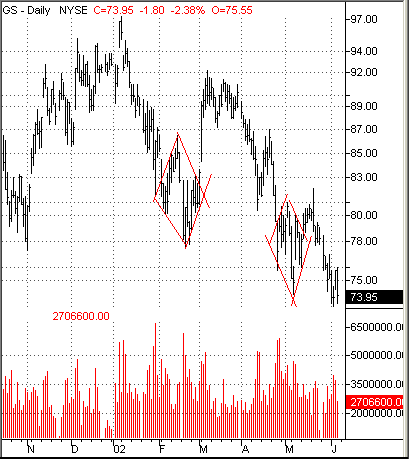 Figure 2: The diamonds giveth and the diamonds taketh away as Goldman Sachs tests year-to-date lows. The second decline for GS in 2002 also saw the shares fall into a diamond pattern. This time, the bottom of the diamond corresponded with the August 2001 correction low of about 73. While traders could have been forgiven for anticipating another upside breakout, perhaps taking GS as high as 85 or so, the low volume breakout in early May provided little hope that upside follow-through would be forthcoming (compare the February breakout to the May breakout). At present, GS is trading around 73, the support area that tends to form at the bottom of a diamond pattern. However, there is only so much consolation that can be gained by this support for after 73, as the saying goes, it's turtles all the down. The next stop is the post-September 11th low territory of 63. |
Technical Writer for Technical Analysis of STOCKS & COMMODITIES magazine, Working-Money.com, and Traders.com Advantage.
| Title: | Technical Writer |
| Company: | Technical Analysis, Inc. |
| Address: | 4757 California Avenue SW |
| Seattle, WA 98116 | |
| Phone # for sales: | 206 938 0570 |
| Fax: | 206 938 1307 |
| Website: | www.Traders.com |
| E-mail address: | DPenn@traders.com |
Traders' Resource Links | |
| Charting the Stock Market: The Wyckoff Method -- Books | |
| Working-Money.com -- Online Trading Services | |
| Traders.com Advantage -- Online Trading Services | |
| Technical Analysis of Stocks & Commodities -- Publications and Newsletters | |
| Working Money, at Working-Money.com -- Publications and Newsletters | |
| Traders.com Advantage -- Publications and Newsletters | |
| Professional Traders Starter Kit -- Software | |
Click here for more information about our publications!
PRINT THIS ARTICLE

Request Information From Our Sponsors
- StockCharts.com, Inc.
- Candle Patterns
- Candlestick Charting Explained
- Intermarket Technical Analysis
- John Murphy on Chart Analysis
- John Murphy's Chart Pattern Recognition
- John Murphy's Market Message
- MurphyExplainsMarketAnalysis-Intermarket Analysis
- MurphyExplainsMarketAnalysis-Visual Analysis
- StockCharts.com
- Technical Analysis of the Financial Markets
- The Visual Investor
- VectorVest, Inc.
- Executive Premier Workshop
- One-Day Options Course
- OptionsPro
- Retirement Income Workshop
- Sure-Fire Trading Systems (VectorVest, Inc.)
- Trading as a Business Workshop
- VectorVest 7 EOD
- VectorVest 7 RealTime/IntraDay
- VectorVest AutoTester
- VectorVest Educational Services
- VectorVest OnLine
- VectorVest Options Analyzer
- VectorVest ProGraphics v6.0
- VectorVest ProTrader 7
- VectorVest RealTime Derby Tool
- VectorVest Simulator
- VectorVest Variator
- VectorVest Watchdog