HOT TOPICS LIST
- MACD
- Fibonacci
- RSI
- Gann
- ADXR
- Stochastics
- Volume
- Triangles
- Futures
- Cycles
- Volatility
- ZIGZAG
- MESA
- Retracement
- Aroon
INDICATORS LIST
LIST OF TOPICS
PRINT THIS ARTICLE
by Koos van der Merwe
We all know that banks caused the recent market meltdown, and that they are now under close scrutiny to make sure that their greed is controlled.
Position: Accumulate
Koos van der Merwe
Has been a technical analyst since 1969, and has worked as a futures and options trader with First Financial Futures in Johannesburg, South Africa.
PRINT THIS ARTICLE
MOVING AVERAGES
Do You Want To Buy A Bank?
05/15/12 09:38:06 AMby Koos van der Merwe
We all know that banks caused the recent market meltdown, and that they are now under close scrutiny to make sure that their greed is controlled.
Position: Accumulate
| The greed of the banks, placing client deposits into risky assets like mortgage-backed securities, caused the recent market meltdown. Their books and investment strategies are under close scrutiny, and the Volcker rule, a specific section of the Dodd-Frank Wall Street Reform and Consumer Protection Act that has been proposed by economist and former Federal Reserve Chairman Paul Volcker to restrict US banks from making certain kinds of speculative investments that do not benefit their customers, is still in the works, and could become law sometime this year. However, there are banks that were already under close scrutiny, carefully watched, and were not part of the global meltdown to the extent American banks were. Those banks reside in Canada, where no bank received a government bailout to weather the crises. One of them, Toronto Dominion Bank (TD), is worth looking at. |

|
| FIGURE 1: TD, MONTHLY |
| Graphic provided by: AdvancedGET. |
| |
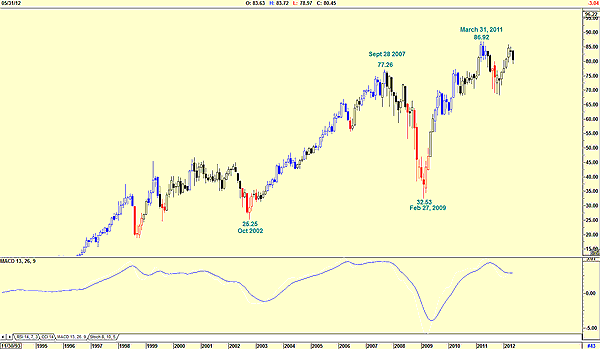
| Figure 1 is a monthly chart and shows that yes indeed, Canada's banks did indeed fall heavily as the banking crises took hold in the US and Europe. In October 2002, the price of TD Bank was $25.25 and then rose strongly to a high of $77.26 by September 28, 2007. The share price then collapsed to $32.53 by February 27, 2009, a 57.9% collapse. From that date, the share price rose steadily to a high of $86.92 by March 2011. The chart shows that the share price appears to have now formed a double top, at $8. |

|
| FIGURE 2: TD, DAILY |
| Graphic provided by: AdvancedGET. |
| |
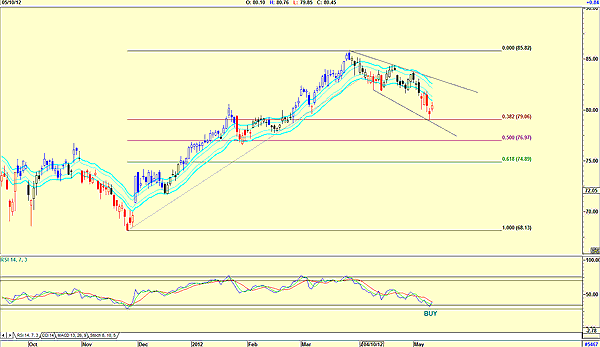
| Figure 2, a daily chart of TD Bank, shows how the price moved from a low of $68.13 to a high of $85.82. The share price is currently testing the 38.2% Fibonacci level at $79.06. The relative strength index (RSI) has given a buy signal, suggesting that traders could buy the stock, while investors could wait until the price breaks above the upper line of the JM internal band indicator. What is disturbing is that the trendlines drawn do suggest a trumpet-shaped formation. This type of formation suggests indecision. To finalize my decision whether to buy, I looked at the chart in Figure 3. |

|
| FIGURE 3: TD DAILY, OMNITRADER |
| Graphic provided by: OmniTrader. |
| |
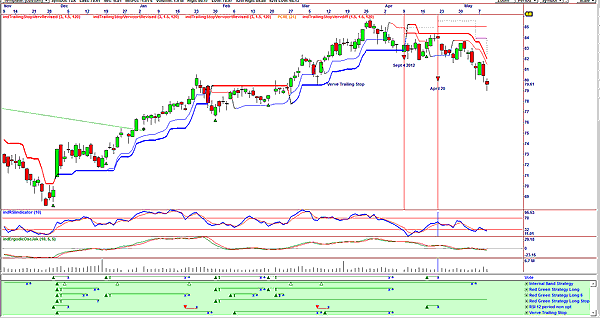
| Figure 3 shows that a stop-loss signal was given on September 4, 2012, when the price broke below the Verve trailing stop-loss. This was reinforced on April 20, when the vote line, a summation of the six strategies shown in green below the vote line, gave a stop signal. At the moment, the vote line has not given a buy signal, although the strategy, red green long stop, is still in positive mode. TD Bank is on my watchlist, even though Figure 2 is suggesting an RSI buy signal. I would rather wait for a confirmatory buy signal by the chart in Figure 3, or a break above the upper JM internal band line. |
Has been a technical analyst since 1969, and has worked as a futures and options trader with First Financial Futures in Johannesburg, South Africa.
| Address: | 3256 West 24th Ave |
| Vancouver, BC | |
| Phone # for sales: | 6042634214 |
| E-mail address: | petroosp@gmail.com |
Click here for more information about our publications!
PRINT THIS ARTICLE

Request Information From Our Sponsors
- VectorVest, Inc.
- Executive Premier Workshop
- One-Day Options Course
- OptionsPro
- Retirement Income Workshop
- Sure-Fire Trading Systems (VectorVest, Inc.)
- Trading as a Business Workshop
- VectorVest 7 EOD
- VectorVest 7 RealTime/IntraDay
- VectorVest AutoTester
- VectorVest Educational Services
- VectorVest OnLine
- VectorVest Options Analyzer
- VectorVest ProGraphics v6.0
- VectorVest ProTrader 7
- VectorVest RealTime Derby Tool
- VectorVest Simulator
- VectorVest Variator
- VectorVest Watchdog
- StockCharts.com, Inc.
- Candle Patterns
- Candlestick Charting Explained
- Intermarket Technical Analysis
- John Murphy on Chart Analysis
- John Murphy's Chart Pattern Recognition
- John Murphy's Market Message
- MurphyExplainsMarketAnalysis-Intermarket Analysis
- MurphyExplainsMarketAnalysis-Visual Analysis
- StockCharts.com
- Technical Analysis of the Financial Markets
- The Visual Investor
