

HOT TOPICS LIST
- MACD
- Fibonacci
- RSI
- Gann
- ADXR
- Stochastics
- Volume
- Triangles
- Futures
- Cycles
- Volatility
- ZIGZAG
- MESA
- Retracement
- Aroon
INDICATORS LIST
LIST OF TOPICS
PRINT THIS ARTICLE
by Donald W. Pendergast, Jr.
Down by 60% since peaking in April 2011, shares of Pan American Silver may be at or near an important turning point.
Position: N/A
Donald W. Pendergast, Jr.
Donald W. Pendergast is a financial markets consultant who offers specialized services to stock brokers and high net worth individuals who seek a better bottom line for their portfolios.
PRINT THIS ARTICLE
FIBONACCI
PAAS To Turn Higher?
05/10/12 09:18:08 AMby Donald W. Pendergast, Jr.
Down by 60% since peaking in April 2011, shares of Pan American Silver may be at or near an important turning point.
Position: N/A
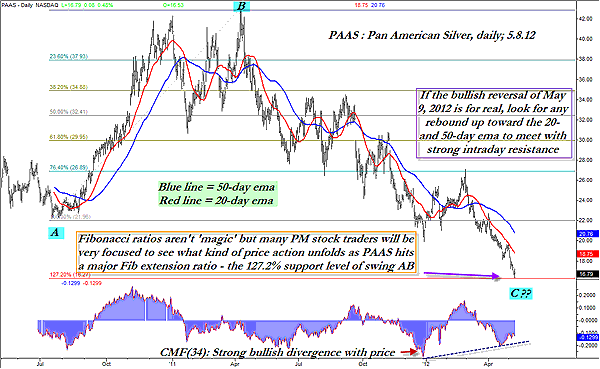
| Pan American Silver's (PAAS) final ascent to the 43.06 peak of early April 2011 was as fast, smooth, and powerful as its subsequent bear market collapse has been slow, tortuous, and frustrating, with the stock shedding a full 60% of its value since the heady precious metals mania spike in the spring of 2011. Now, however, there may be a couple of technical clues on the stock's daily chart (Figure 1) that may be suggesting that it may be due for another bounce higher. Here's a closer look now. |
|
| FIGURE 1: PAAS, DAILY. The selling in shares of PAAS has been especially vicious and relentless since February 29, 2012, with the stock down 36% in a little more than two months. The major money flow divergence with price suggests that a major low may not be far off. |
| Graphic provided by: TradeStation. |
| |
| You'll note the A-B-C labels for each major swing on the daily chart in Figure 1; with a Fibonacci retracement grid overlaid on it, we find that the low of Tuesday, May 8, 2012, lines up almost exactly with the Fibonacci 127.2% retracement level of major swing AB. For Fibonacci aficionados, this is big news, of course, but for nonbelievers in the Fibonacci ratio theory, it's just another random line drawn on a chart that is just as likely as not to be hit. The Fibonacci phenomenon is fascinating, but I would be hard-pressed to construct a winning trading methodology based solely upon its basic premises. However, one thing I have learned over the years -- analyzing thousands and thousands of price charts -- is that whether Fibonacci has any intrinsic scientific/technical value at all, it is quite clear that many traders look at these ratios and base at least part of their trading methodology upon it. With this being the case, it only makes sense to pay attention to all of the major Fibonacci ratios on the charts I track, being aware of all the potential support/resistance (S/R) levels formed by such Fibonacci levels. |
|
| FIGURE 2: PAAS. PAAS begins to rise, albeit slowly, up by 0.66% during mid-afternoon trading on May 9, 2012. |
| Graphic provided by: TradeStation. |
| |
| One terrific way to get the most out of potential key Fibonacci turning points is to look for notable price/momentum and price/money flow divergences near the following types of Fibonacci S/R levels: 1. Any combination of key Fibonacci ratios (from different degrees of trend) that print very close to the same price level. For example, if you see a 38% retracement from a major swing at the same general price level as a Fibonacci 62% retracement from a smaller degree of trend, you can, in many cases expect such a support(resistance) level to act as a formidable level to expect some sort of a market reaction, ranging from simple turbulence to an all-out trend reversal. The bigger the price/momentum or money flow divergence that you see at such levels, the higher the probability for a tradable reversal in the near future. 2. When you can see price approaching a major retracement/extension point like the 100%, 127%, 162%, 200%, or 262% level at the same time that a major price/money flow divergence has printed, you may be witnessing the market's early warning that a major low may not be far off. This can be a great tool for traders who are already short a market like PAAS to prepare to tighten stops and/or to begin to scale out of and/or close out existing shorts altogether. PAAS did indeed stage a substantial intraday reversal (printing an outside bar key reversal) on Wednesday, May 9, 2012, so it is possible this is the first minor surge against a ton of massive, long-lasting overhead resistance in this key precious metals stock. However, before attempting to get back in on the long side, it would be wise to wait for sign of continued momentum with a break above Wednesday's high of 17.24. See Figure 2. Such a break could be a great time to sell a near-term out-of-the-money put option, as option volatilties are high, thus allowing you to get a pretty decent premium -- one that will quickly erode and put extra coins in your pocket, should PAAS decide it wants to meet up with its 20-day exponential moving average (EMA) (red line on chart) sooner rather than later. If you do go this route trading PAAS, be sure that you buy the sold put option back if it doubles in price. Similarly, if the premium quickly withers down to only 20% or 25% of what you sold it for, you may wish to act quickly and buy it back so that your hard-won profits don't evaporate into thin air on a sudden move back lower. And never risk more than 1% to 2% on any individual trade, no matter if you trade stocks, options, or futures. |
Donald W. Pendergast is a financial markets consultant who offers specialized services to stock brokers and high net worth individuals who seek a better bottom line for their portfolios.
| Title: | Writer, market consultant |
| Company: | Linear Trading Systems LLC |
| Jacksonville, FL 32217 | |
| Phone # for sales: | 904-239-9564 |
| E-mail address: | lineartradingsys@gmail.com |
Traders' Resource Links | |
| Linear Trading Systems LLC has not added any product or service information to TRADERS' RESOURCE. | |
Click here for more information about our publications!
PRINT THIS ARTICLE

Request Information From Our Sponsors
- VectorVest, Inc.
- Executive Premier Workshop
- One-Day Options Course
- OptionsPro
- Retirement Income Workshop
- Sure-Fire Trading Systems (VectorVest, Inc.)
- Trading as a Business Workshop
- VectorVest 7 EOD
- VectorVest 7 RealTime/IntraDay
- VectorVest AutoTester
- VectorVest Educational Services
- VectorVest OnLine
- VectorVest Options Analyzer
- VectorVest ProGraphics v6.0
- VectorVest ProTrader 7
- VectorVest RealTime Derby Tool
- VectorVest Simulator
- VectorVest Variator
- VectorVest Watchdog
- StockCharts.com, Inc.
- Candle Patterns
- Candlestick Charting Explained
- Intermarket Technical Analysis
- John Murphy on Chart Analysis
- John Murphy's Chart Pattern Recognition
- John Murphy's Market Message
- MurphyExplainsMarketAnalysis-Intermarket Analysis
- MurphyExplainsMarketAnalysis-Visual Analysis
- StockCharts.com
- Technical Analysis of the Financial Markets
- The Visual Investor