HOT TOPICS LIST
- MACD
- Fibonacci
- RSI
- Gann
- ADXR
- Stochastics
- Volume
- Triangles
- Futures
- Cycles
- Volatility
- ZIGZAG
- MESA
- Retracement
- Aroon
INDICATORS LIST
LIST OF TOPICS
PRINT THIS ARTICLE
by Mike Carr, CMT
Technicians usually analyze price moves to trade stocks and other securities. However, they can also apply their skills to economic analysis.
Position: Sell
Mike Carr, CMT
Mike Carr, CMT, is a member of the Market Technicians Association, and editor of the MTA's newsletter, Technically Speaking. He is also the author of "Smarter Investing in Any Economy: The Definitive Guide to Relative Strength Investing," and "Conquering the Divide: How to Use Economic Indicators to Catch Stock Market Trends."
PRINT THIS ARTICLE
MOMENTUM
Recession Warning From Technical Analysis
05/10/12 09:04:11 AMby Mike Carr, CMT
Technicians usually analyze price moves to trade stocks and other securities. However, they can also apply their skills to economic analysis.
Position: Sell
| Technical analysis began with the reading of price charts many years ago. Indicators have been added to the study of chart analysis and technicians now apply a number of tools that are based on price. Their efforts are usually confined to forecasting or reacting to price movements. Some technicians apply approaches, like Elliott wave or Gann theory, that are designed to find turning points in advance. These are forecasting methods. Others use techniques like trend-following strategies that are intended to help them make money by reacting to what the market does. Either set of tools could be adapted and applied to analyzing economic data. |
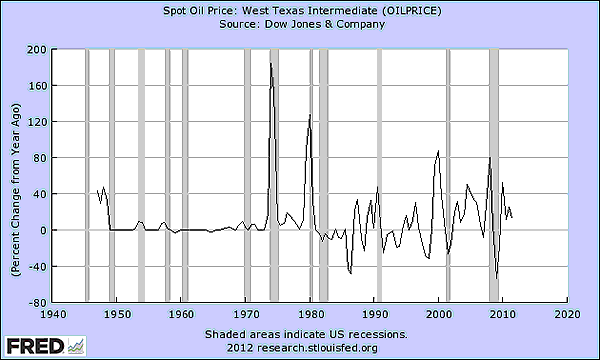
| A simple economic analysis can be done with oil prices. Some commentators claim that oil price spikes always precede recessions, and they seem to believe that higher oil prices choke off economic growth. This theory is logical. Consumers only have so much income. If they are forced to devote more of that income to necessities like gas, they have less discretionary income and the economy declines as consumer spending shifts toward basics. An alternative theory is that oil prices reflect supply and demand and oil goes up when the economy is building strength and oil declines when the economy is slowing. A simple chart analysis (Figure 1) supports the latter interpretation. |

|
| FIGURE 1: OIL. Oil price spikes do precede recessions, but the recession appears to start after the peak in prices occurs. |
| Graphic provided by: Federal Reserve. |
| |
| Oil price spikes do come before recessions. Figure 1 shows the annual rate of change in oil prices rather than the price of oil. It is also smoothed to show only two data points a year to make the chart easier to read. With monthly data, the direction and degree of trends are the same but the line is more jagged. Recessions are highlighted by gray bars. On close inspection, we can see that prices stop rising before a recession in almost all cases. From a simple visual analysis, that would indicate the recession starts after the demand for oil decreases and the price of oil starts dropping. Not all price rises lead to a recession, so other tools should be used along with this simple approach. |
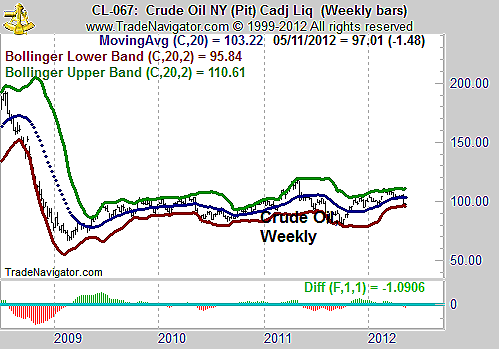
| Traditional technical tools confirm that the outlook for oil is most likely bearish. The moving average convergence/divergence (MACD) is negative on the weekly chart (Figure 2). Simple MACD signals applied to the weekly chart of crude oil offer profitable trading signals, with a profit factor of 1.90 on short trades. The average winning short trade in oil using MACD lasts more than a year, 65 weeks. |

|
| FIGURE 2: CRUDE OIL, WEEKLY. Oil prices are near their lower Bollinger Band, and additional downside is often seen in futures markets when prices fall to this level. |
| Graphic provided by: Trade Navigator. |
| |
| Intermarket analysis can then help us develop a forecast for stock prices. Declining oil prices show that the chance of a recession is higher than average. The chart of oil prices confirms that oil could be starting a bear market in oil. This is not a definite signal that a recession is certain, but it is something worth paying attention. Stocks generally decline in a recession, and the peak in stocks is often close to or after the peak in economic activity. These factors point to the fact that traders should be cautious when trading stocks and a bearish bias, at least in the shorter term, is prudent. Bearish signals on stock charts should not be ignored or considered to be dips in a bull market. Oil is indicating that there could be a buying opportunity in stocks later this year. |
Mike Carr, CMT, is a member of the Market Technicians Association, and editor of the MTA's newsletter, Technically Speaking. He is also the author of "Smarter Investing in Any Economy: The Definitive Guide to Relative Strength Investing," and "Conquering the Divide: How to Use Economic Indicators to Catch Stock Market Trends."
| Website: | www.moneynews.com/blogs/MichaelCarr/id-73 |
| E-mail address: | marketstrategist@gmail.com |
Click here for more information about our publications!
PRINT THIS ARTICLE

Request Information From Our Sponsors
- StockCharts.com, Inc.
- Candle Patterns
- Candlestick Charting Explained
- Intermarket Technical Analysis
- John Murphy on Chart Analysis
- John Murphy's Chart Pattern Recognition
- John Murphy's Market Message
- MurphyExplainsMarketAnalysis-Intermarket Analysis
- MurphyExplainsMarketAnalysis-Visual Analysis
- StockCharts.com
- Technical Analysis of the Financial Markets
- The Visual Investor
- VectorVest, Inc.
- Executive Premier Workshop
- One-Day Options Course
- OptionsPro
- Retirement Income Workshop
- Sure-Fire Trading Systems (VectorVest, Inc.)
- Trading as a Business Workshop
- VectorVest 7 EOD
- VectorVest 7 RealTime/IntraDay
- VectorVest AutoTester
- VectorVest Educational Services
- VectorVest OnLine
- VectorVest Options Analyzer
- VectorVest ProGraphics v6.0
- VectorVest ProTrader 7
- VectorVest RealTime Derby Tool
- VectorVest Simulator
- VectorVest Variator
- VectorVest Watchdog
