HOT TOPICS LIST
- MACD
- Fibonacci
- RSI
- Gann
- ADXR
- Stochastics
- Volume
- Triangles
- Futures
- Cycles
- Volatility
- ZIGZAG
- MESA
- Retracement
- Aroon
INDICATORS LIST
LIST OF TOPICS
PRINT THIS ARTICLE
by Billy Williams
Anyone can talk about today's stock leaders as though they were obvious picks in the past, but the real skill is finding tomorrow's winners in today's market.
Position: Buy
Billy Williams
Billy Williams has been trading the markets for 27 years, specializing in momentum trading with stocks and options.
PRINT THIS ARTICLE
STOCKS
Finding Winning Stocks
05/10/12 08:49:46 AMby Billy Williams
Anyone can talk about today's stock leaders as though they were obvious picks in the past, but the real skill is finding tomorrow's winners in today's market.
Position: Buy
| Almost nightly, on any given financial news cable show, the latest and greatest-performing stocks are ushered out in front of the public and put on display as stocks whose stellar returns were painfully obvious to even the most dull investor. Sadly, this pattern is played out over and over again but not before legions of investors and traders rush to place buy orders on the sure thing. But the awful truth is that the stock's trend has typically run its course just as these Johnny-come-lately buyers rush into the market like lemmings running off the edge of a cliff. Runaway stocks are not obvious to the layman at first but instead are lying inert in unknown segments of the market until some catalyst sparks signs of life into its price action and it begins to take on the compelling characteristics of a worthy investment or trade. There is a long and arduous process involved in finding these stocks, but well worth it to a trader willing to put in the effort. |

|
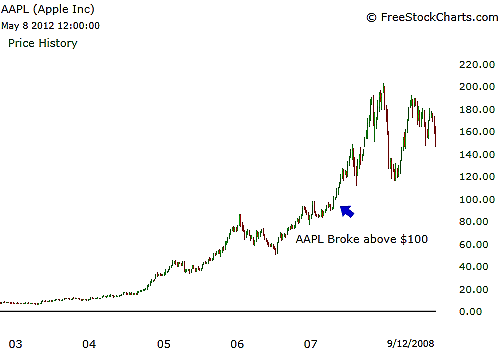
| FIGURE 1: AAPL. In May 2007, Apple began to emerge as a stock leader, but its bullish trend began to really accelerate as the stock traded above $100 a share. |
| Graphic provided by: www.freestockcharts.com. |
| |
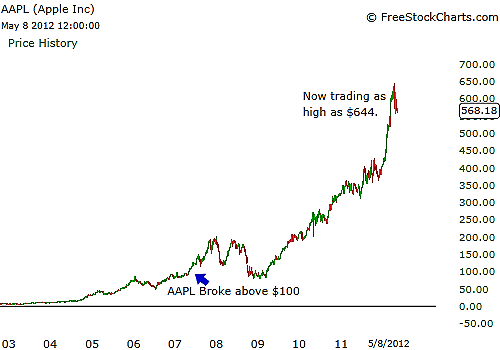
| First, go to any free stock scanner to find stocks with prices of $60 or greater and a six-month relative strength of 80 or higher. Obviously, the higher the RS the better, because as these stocks exhibit high RS on a six-month average, they are likely to gather steam and go higher over time. Anything over $60 is a good candidate but special note should be given to stocks $100 or more because they tend to trend well. Go back and note that Apple Inc. (AAPL) always performed well, but once it began trading over $100, you can see for yourself that AAPL really outperformed the market. See Figures 1 and 2. Gather a list of strong stocks (high relative strength) and then break that list down to look at their fundamentals as detailed in the manual. |

|
| FIGURE 2: AAPL. After the stock traded above $100, it went through a few peaks and valleys, yet its ascent continued and eventually increased to more than 644% over the next five years from the $100 milestone. |
| Graphic provided by: www.freestockcharts.com. |
| |
| This is when you take your initial list and go to one of the popular financial sites (for example, Yahoo Finance) and start your due diligence and research. Next, you want to look for common themes when you start breaking down your list to look at the individual parts of the fundamental criteria. If lots of stocks are coming up in a given sector or industry, then you should definitely take note of it because it could indicate that you may have found a segment of the market that is set to outperform the rest and lead the general market higher. These are typically stocks that no one is looking at yet but have the potential to be the stock or sector that the talking heads rave about one to three years from now. |
| Stocks with strong annual sales revenue, quarter-over-quarter growth of 25% or more, low to no debt, return on equity of 17% or more, strong competitive advantages in its marketplace, and strong earning per share growth are key criteria that you want to take note of and use to filter your list of potential stock candidates. Once you've filtered through these stocks, you have a hit list of potential candidates. Like a sniper, you wait, observe, and then execute your trades as price patterns and setups present themselves but always respect risk and know your exits. |
Billy Williams has been trading the markets for 27 years, specializing in momentum trading with stocks and options.
| Company: | StockOptionSystem.com |
| E-mail address: | stockoptionsystem.com@gmail.com |
Traders' Resource Links | |
| StockOptionSystem.com has not added any product or service information to TRADERS' RESOURCE. | |
Click here for more information about our publications!
PRINT THIS ARTICLE

Request Information From Our Sponsors
- StockCharts.com, Inc.
- Candle Patterns
- Candlestick Charting Explained
- Intermarket Technical Analysis
- John Murphy on Chart Analysis
- John Murphy's Chart Pattern Recognition
- John Murphy's Market Message
- MurphyExplainsMarketAnalysis-Intermarket Analysis
- MurphyExplainsMarketAnalysis-Visual Analysis
- StockCharts.com
- Technical Analysis of the Financial Markets
- The Visual Investor
- VectorVest, Inc.
- Executive Premier Workshop
- One-Day Options Course
- OptionsPro
- Retirement Income Workshop
- Sure-Fire Trading Systems (VectorVest, Inc.)
- Trading as a Business Workshop
- VectorVest 7 EOD
- VectorVest 7 RealTime/IntraDay
- VectorVest AutoTester
- VectorVest Educational Services
- VectorVest OnLine
- VectorVest Options Analyzer
- VectorVest ProGraphics v6.0
- VectorVest ProTrader 7
- VectorVest RealTime Derby Tool
- VectorVest Simulator
- VectorVest Variator
- VectorVest Watchdog
