HOT TOPICS LIST
- MACD
- Fibonacci
- RSI
- Gann
- ADXR
- Stochastics
- Volume
- Triangles
- Futures
- Cycles
- Volatility
- ZIGZAG
- MESA
- Retracement
- Aroon
INDICATORS LIST
LIST OF TOPICS
PRINT THIS ARTICLE
by Donald W. Pendergast, Jr.
The noticeable trading range market behavior of the past few months appears to have given way to another leg down in the broad US markets.
Position: N/A
Donald W. Pendergast, Jr.
Donald W. Pendergast is a financial markets consultant who offers specialized services to stock brokers and high net worth individuals who seek a better bottom line for their portfolios.
PRINT THIS ARTICLE
CHART ANALYSIS
Broad Markets Finally Break Lower
05/09/12 09:30:12 AMby Donald W. Pendergast, Jr.
The noticeable trading range market behavior of the past few months appears to have given way to another leg down in the broad US markets.
Position: N/A
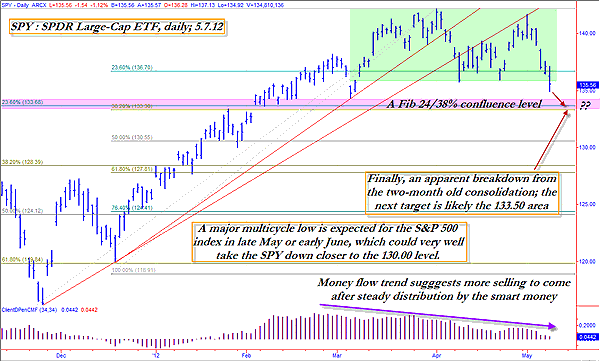
| Like many other market technicians, I subscribe to a variety of newsletters and financial publications to help better my own trading endeavors, and I am always amazed at the variety of market predictions that are being bandied about at any given time -- ranging from the outlandishly bullish to the foreboding, depressing world view of the permabears and the gold and silver bugs. In the end, reading such market opinions tends to create more confusion than clarity, thus leading me straight back to my charts and systems. We'll take a look at the daily chart of the SPDRs large-cap exchange traded fund (ETF) (the S&P 500 index ETF) and examine the probable support levels that this widely tracked index is likely to meet up with in the weeks ahead. See Figure 1. |

|
| FIGURE 1: SPY, DAILY. With the first stage of the consolidation breakout under way, the big question for traders is whether the Fibonacci confluence level near 133.50 will be strong enough to ignite a minor short-covering rally. |
| Graphic provided by: TradeStation. |
| |
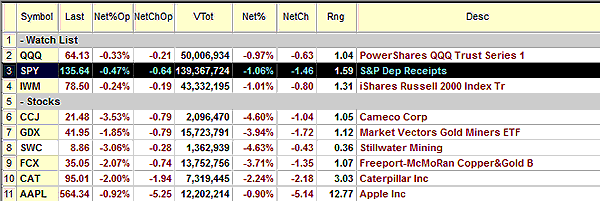
| In early March 2012, the SPY began its final runup to the post-crash (2007-09) high of 142.21, reached on April 2, 2012. The market pulled back, chopped a bit, and then made another minor run higher in late April-early May 2012, failing to meet, much less exceed, the April high (technically known as a "failure swing") and has since been in declining mode, erasing much of the gains made in March and April in only six trading sessions. Clearly, market psychology has turned negative, as even the mighty Apple Inc. (AAPL) is down nearly $90 per share since early April 2012. On the chart, you can see that SPY has broken down from the green shaded consolidation zone and looks very likely on target to test the twin Fibonacci confluence levels (24% and 38%, respectively) near 133.50 (pink shaded line), an area that is expected to provide some sort of a tradable bounce for short-term market players. Meanwhile, at the bottom of the chart you can see that the medium-term money flow (the 34-day Chaikin money flow histogram (CMF)(34)) has been in declining mode for several months now, with the recent selloff acting as confirmation that steady distribution (from the smart money to the dumb) had been under way since late February 2012. See Figure 2. |

|
| FIGURE 2: STOCKS. While the SPY and other stock index EEFs were off by another 1% on May 8, 2012, most mining industry group stocks were posting much larger losses. |
| Graphic provided by: TradeStation. |
| |
| Playing SPY here could be risky. However, if you run your scanning/exploration applications in your favorite charting software, you might want to focus trading the following kinds of stocks short: 1. Large- and mid-cap stocks that are underperforming the .SPX over the past four- and 13-week periods 2. Stocks that are not about to pay a dividend (in other words, try not to be short a stock on the day of its dividend record date) 3. Stocks with poor earnings growth projections or other obviously bearish fundamentals like declining market share, declining earnings, and so on. Once you locate these stocks, you'll want to overlay some kind of proven mechanical trading strategy on their daily charts to see which ones are firing new sell signals. If you go short any of them, remember to: 1. Limit your maximum account risk to 1% or 2% 2. Run a close initial/trailing stop. Perhaps a two-bar trailing stop of the daily highs would be a good one to employ 3. Be prepared to close out a short position early if you see the SPY quickly approach the 133.50 area. This could be a prime location for a short-covering rally in the SPY/.SPX and you may wish to avoid that altogether, along with the carnage it could inflict upon your trading account. This general framework is very straightforward and should at least give you a minor edge over those traders/investors who rely solely on newsletters, hot tips, relatives, and friends for their trading ideas. |
Donald W. Pendergast is a financial markets consultant who offers specialized services to stock brokers and high net worth individuals who seek a better bottom line for their portfolios.
| Title: | Writer, market consultant |
| Company: | Linear Trading Systems LLC |
| Jacksonville, FL 32217 | |
| Phone # for sales: | 904-239-9564 |
| E-mail address: | lineartradingsys@gmail.com |
Traders' Resource Links | |
| Linear Trading Systems LLC has not added any product or service information to TRADERS' RESOURCE. | |
Click here for more information about our publications!
PRINT THIS ARTICLE

Request Information From Our Sponsors
- StockCharts.com, Inc.
- Candle Patterns
- Candlestick Charting Explained
- Intermarket Technical Analysis
- John Murphy on Chart Analysis
- John Murphy's Chart Pattern Recognition
- John Murphy's Market Message
- MurphyExplainsMarketAnalysis-Intermarket Analysis
- MurphyExplainsMarketAnalysis-Visual Analysis
- StockCharts.com
- Technical Analysis of the Financial Markets
- The Visual Investor
- VectorVest, Inc.
- Executive Premier Workshop
- One-Day Options Course
- OptionsPro
- Retirement Income Workshop
- Sure-Fire Trading Systems (VectorVest, Inc.)
- Trading as a Business Workshop
- VectorVest 7 EOD
- VectorVest 7 RealTime/IntraDay
- VectorVest AutoTester
- VectorVest Educational Services
- VectorVest OnLine
- VectorVest Options Analyzer
- VectorVest ProGraphics v6.0
- VectorVest ProTrader 7
- VectorVest RealTime Derby Tool
- VectorVest Simulator
- VectorVest Variator
- VectorVest Watchdog
