HOT TOPICS LIST
- MACD
- Fibonacci
- RSI
- Gann
- ADXR
- Stochastics
- Volume
- Triangles
- Futures
- Cycles
- Volatility
- ZIGZAG
- MESA
- Retracement
- Aroon
INDICATORS LIST
LIST OF TOPICS
PRINT THIS ARTICLE
by Ron Walker
A head & shoulders top on the Russell 2000 could be hinting that a major top is setting up in the market.
Position: Sell
Ron Walker
Ron Walker is an active trader and technical analyst. He operates an educational website dedicated to the study of Technical Analysis. The website offers free market analysis with daily video presentations and written commentaries. Ron is a video pioneer, being one of the first to utilize the internet producing Technical Analysis videos. His website is thechartpatterntrader.com
PRINT THIS ARTICLE
HEAD & SHOULDERS
A Head & Shoulders Top Awaits Confirmation On The Russell 2000
05/09/12 08:22:53 AMby Ron Walker
A head & shoulders top on the Russell 2000 could be hinting that a major top is setting up in the market.
Position: Sell
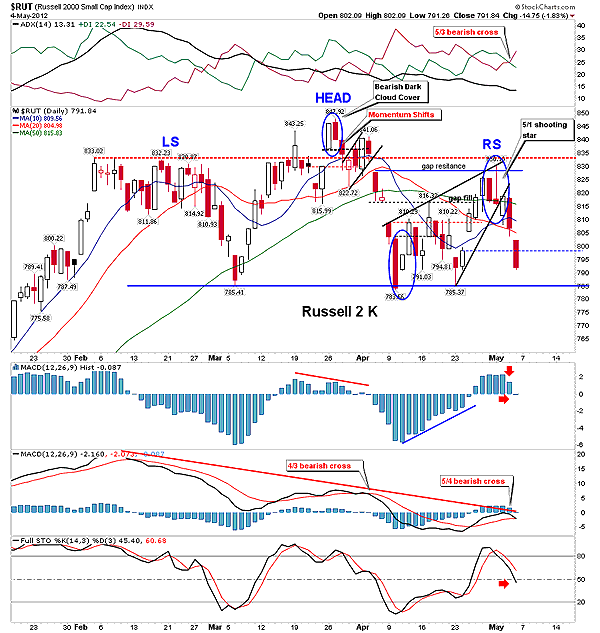
| The first sign of trouble for the Russell 2000 ($RUT) appeared in late March after two false breakouts occurred. Prices attempted to clear overhead resistance at 833 in mid- and late March (Figure 1). Both attempts to break out eventually failed, and prices quickly sank back down. The breakout in mid-March was a head fake, only holding above resistance for one session. The following day, prices slid back below the breakout point. We know that sellers were lurking just above resistance at the breakout by the long topping tail on the candlestick for that session. On the second attempted breakout in late March, the day after the breakout, a bearish dark cloud cover two-day candle pattern appeared. The pattern was confirmed the next day, as prices closed below the low of the pattern. This led to negative divergence on the moving average convergence/divergence (MACD) (12, 26, 9) anticipating a top on the $RUT. Neither one of these breakouts yielded any significant follow-through to the upside on closing basis. |

|
| FIGURE 1: $RUT, DAILY Reversal candle patterns at the last two peaks cement a head & shoulders topping pattern on the $RUT. Meanwhile, bearish indicators loom over the chart. |
| Graphic provided by: StockCharts.com. |
| |
| After the second failure, prices set up a bear flag pattern and fell back below the 10-, 20-, and 50-day moving averages (MAs). The small-cap index took a nosedive in early April, falling back to test key support at 785. Prices slightly breached support, shaking out weak longs, and then quickly rebounded back up toward the 833 level of resistance once again. Prices leaped above the 50-day MA, but couldn't clear overhead resistance at 833. A few days later, a candlestick with a long upper shadow formed with a small real body in the lower half of the candle, forming a bearish shooting star pattern at this peak and a bearish rising wedge pattern reversal pattern. Once again, prices began to plummet below the moving averages. |
| As the $RUT does the sidestep, it is etching out a very large head & shoulders reversal pattern, with the right shoulder under construction currently. If price falls beneath the consolidation threshold lows of 783, it will validate a large head & shoulders top and change the trend. But if prices hold above the neckline of the pattern near 783, it would negate this bearish pattern and eliminate its validity as a sell signal. |
| However, the chances of this pattern running its course have just dramatically increased. Previously negative divergence formed on the MACD after the failed breakouts, thereby completing the left shoulder and the head of head & shoulders pattern. After the last rally failed to clear 833, prices peaked forming a lower high. The MACD rolled over at the center line and set up a lower high as well. The MACD is validating the lower price high. Further, the histogram dipped back below zero, the direction indicators (the DI lines) have gotten a bearish crossover on the average directional movement index (ADX), and the stochastic has rolled over and slipped back below 50. The moving averages reveal even more weakness. The 10- and 20-day MAs were unable to move back above the 50-day MA during the last rally, suggesting that the balance has tipped in favor of the bears. |
| If the pattern plays out, it measures 65 points from the low to the high. If we subtract that from the low point of the pattern at 783, we get a minimum objective target of 718. But the pattern must be confirmed, with the close below the 783 low of the pattern. |
Ron Walker is an active trader and technical analyst. He operates an educational website dedicated to the study of Technical Analysis. The website offers free market analysis with daily video presentations and written commentaries. Ron is a video pioneer, being one of the first to utilize the internet producing Technical Analysis videos. His website is thechartpatterntrader.com
| Website: | thechartpatterntrader.com |
| E-mail address: | thechartpatterntrader@gmail.com |
Click here for more information about our publications!
PRINT THIS ARTICLE

Request Information From Our Sponsors
- StockCharts.com, Inc.
- Candle Patterns
- Candlestick Charting Explained
- Intermarket Technical Analysis
- John Murphy on Chart Analysis
- John Murphy's Chart Pattern Recognition
- John Murphy's Market Message
- MurphyExplainsMarketAnalysis-Intermarket Analysis
- MurphyExplainsMarketAnalysis-Visual Analysis
- StockCharts.com
- Technical Analysis of the Financial Markets
- The Visual Investor
- VectorVest, Inc.
- Executive Premier Workshop
- One-Day Options Course
- OptionsPro
- Retirement Income Workshop
- Sure-Fire Trading Systems (VectorVest, Inc.)
- Trading as a Business Workshop
- VectorVest 7 EOD
- VectorVest 7 RealTime/IntraDay
- VectorVest AutoTester
- VectorVest Educational Services
- VectorVest OnLine
- VectorVest Options Analyzer
- VectorVest ProGraphics v6.0
- VectorVest ProTrader 7
- VectorVest RealTime Derby Tool
- VectorVest Simulator
- VectorVest Variator
- VectorVest Watchdog
