HOT TOPICS LIST
- MACD
- Fibonacci
- RSI
- Gann
- ADXR
- Stochastics
- Volume
- Triangles
- Futures
- Cycles
- Volatility
- ZIGZAG
- MESA
- Retracement
- Aroon
INDICATORS LIST
LIST OF TOPICS
PRINT THIS ARTICLE
by Donald W. Pendergast, Jr.
Will shares of Allstate Corp. manage another run higher after its recent consolidation, or is the downward pull of multiple price cycles going to be the determining factor in the stock's near-term direction?
Position: N/A
Donald W. Pendergast, Jr.
Donald W. Pendergast is a financial markets consultant who offers specialized services to stock brokers and high net worth individuals who seek a better bottom line for their portfolios.
PRINT THIS ARTICLE
CYCLES
ALL Heading For A May Cycle Low?
05/09/12 08:14:07 AMby Donald W. Pendergast, Jr.
Will shares of Allstate Corp. manage another run higher after its recent consolidation, or is the downward pull of multiple price cycles going to be the determining factor in the stock's near-term direction?
Position: N/A
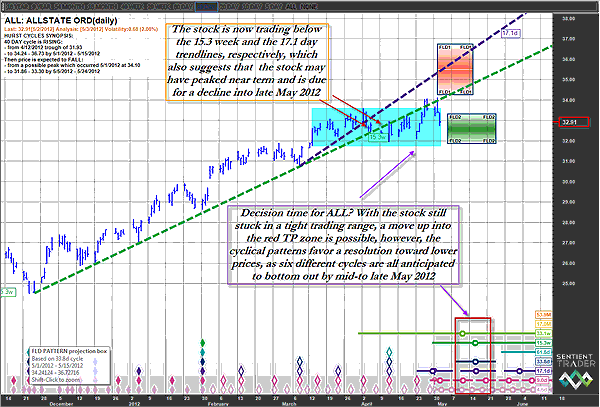
| Shares of Allstate Corp. (ALL) enjoyed a nice run higher from early October 2011 until early May 2012, tacking on gains of more than 50% at the highest point of the rally. Now, however, the stock remains mostly in a range-bound state, one that seems to be ready to complete -- either with another strong surge higher or perhaps even a noticeable descent into its anticipated May 2012 multicycle low. Here a brief look at the situation on ALL's daily chart, along with a few ideas as to what the merry month of May "may" have in store for this particular large cap. See Figure 1. |

|
| FIGURE 1: ALL, DAILY. With ALL now trading below two key trendlines, the probability that a significant top has been made and that the stock is due to bottom into a multicycle low later this month appears to be high. |
| Graphic provided by: Sentient Trader. |
| |
| Both of these daily charts for ALL show just how strong its recent seven-month long rally truly was; for a dividend-paying large-cap stock, this was a very nice time to be a covered-call writer or swing trader for fans of these kinds of stocks. Now, however, the times appear to be a-changin' for ALL, especially since the final push up to the May 1, 2012, high of 34.10 may have actually qualified as a "failure swing" inasmuch as it failed to gain any real traction before falling back down into consolidation pattern (blue shaded area on Figure 1). The current analysis suggests that ALL still may have a shot at making it up toward 37.00 by the middle of May 2012 (see red TP zone box), but with the stock now trading below both the 15.3-week and 17.1-day price cycles, it appears that ALL may have already put in its cycle highs before beginning to descend toward its anticipated multicycle low during the second half of May 2012. The red highlighted area at the bottom of the chart offers a clue as to where as many as six different cycles are projected to bottom together; these include the 4.5, 9.0, 17.1, 33.8, and 61.8 daily cycles as well as the 15.3- and 33.1-week cycles. See Figure 2. |

|
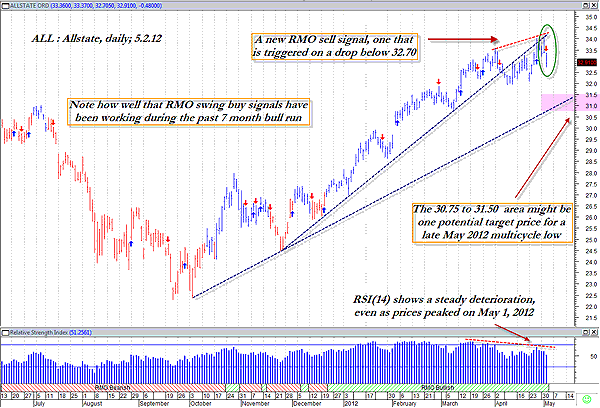
| FIGURE 2: ALL, DAILY. With a steady price/momentum divergence already present, those choosing to go short ALL here may already have the power of six separate price cycles working in their favor as they descend into their May 2012 lows. |
| Graphic provided by: MetaStock. |
| Graphic provided by: RMO trading system indicators from MetaStock 11. |
| |
| Long-term money flow in ALL has also been faltering, manifesting signs of steady distribution in the stock, and the relative strength index (RSI)(14) has also been confirming a steady price/momentum deterioration for some time now. Playing ALL here on the short side involves nothing more complicated that shorting the stock on a drop below Wednesday's low of 32.70 and then running a two- to three-bar trailing stop of the daily highs for the life of the trade or until you see the stock approach the pink shaded support zone near 31.00. That price target, if reached, might be an excellent place to either close out the trade or to take some profits off the table. |
| Playing ALL here on the short side involves nothing more complicated that shorting the stock on a drop below Wednesday's low of 32.70 and then running a two- to three-bar trailing stop of the daily highs for the life of the trade or until you see the stock approach the pink shaded support zone near 31.00. If reached, that price target might be an excellent place to either close out the trade or to take some profits off the table. Trading the short side of the market can be a challenging and sometimes emotionally draining activity, so be sure to put less of your account at risk than usual, should you decide to go short here. Note how well that the RMO (Rahul Mohindar) swing buy signals worked during the seven-month rally in ALL; if you can manage to trade the RMO signals in the direction of the dominant trend, it appears that your chances for success become greater than if you simply trade them right out of the box. Just something you may wish to consider next time using this unique system in MetaStock 11. |
Donald W. Pendergast is a financial markets consultant who offers specialized services to stock brokers and high net worth individuals who seek a better bottom line for their portfolios.
| Title: | Writer, market consultant |
| Company: | Linear Trading Systems LLC |
| Jacksonville, FL 32217 | |
| Phone # for sales: | 904-239-9564 |
| E-mail address: | lineartradingsys@gmail.com |
Traders' Resource Links | |
| Linear Trading Systems LLC has not added any product or service information to TRADERS' RESOURCE. | |
Click here for more information about our publications!
Comments

Request Information From Our Sponsors
- StockCharts.com, Inc.
- Candle Patterns
- Candlestick Charting Explained
- Intermarket Technical Analysis
- John Murphy on Chart Analysis
- John Murphy's Chart Pattern Recognition
- John Murphy's Market Message
- MurphyExplainsMarketAnalysis-Intermarket Analysis
- MurphyExplainsMarketAnalysis-Visual Analysis
- StockCharts.com
- Technical Analysis of the Financial Markets
- The Visual Investor
- VectorVest, Inc.
- Executive Premier Workshop
- One-Day Options Course
- OptionsPro
- Retirement Income Workshop
- Sure-Fire Trading Systems (VectorVest, Inc.)
- Trading as a Business Workshop
- VectorVest 7 EOD
- VectorVest 7 RealTime/IntraDay
- VectorVest AutoTester
- VectorVest Educational Services
- VectorVest OnLine
- VectorVest Options Analyzer
- VectorVest ProGraphics v6.0
- VectorVest ProTrader 7
- VectorVest RealTime Derby Tool
- VectorVest Simulator
- VectorVest Variator
- VectorVest Watchdog
