HOT TOPICS LIST
- MACD
- Fibonacci
- RSI
- Gann
- ADXR
- Stochastics
- Volume
- Triangles
- Futures
- Cycles
- Volatility
- ZIGZAG
- MESA
- Retracement
- Aroon
INDICATORS LIST
LIST OF TOPICS
PRINT THIS ARTICLE
by Donald W. Pendergast, Jr.
Shares of Cameco Corp. have bounced sharply higher since making a major multicycle low in early April 2012. Does the current rally have more room to rise, or is a pullback due soon?
Position: N/A
Donald W. Pendergast, Jr.
Donald W. Pendergast is a financial markets consultant who offers specialized services to stock brokers and high net worth individuals who seek a better bottom line for their portfolios.
PRINT THIS ARTICLE
CCJ Peaking Soon?
05/08/12 08:27:46 AMby Donald W. Pendergast, Jr.
Shares of Cameco Corp. have bounced sharply higher since making a major multicycle low in early April 2012. Does the current rally have more room to rise, or is a pullback due soon?
Position: N/A
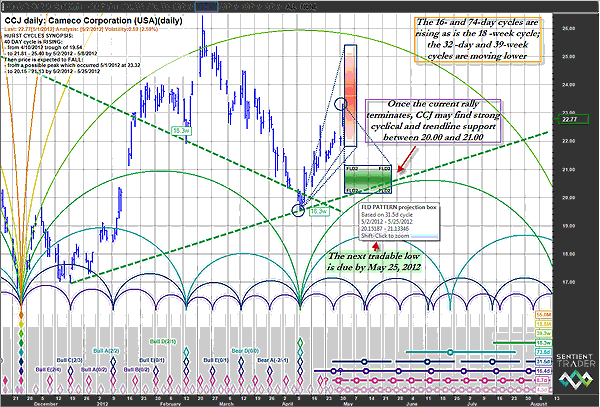
| If you enjoy trading highly volatile, large-cap uranium mining shares, then Cameco Corp.'s common stock (CCJ) might just be a good fit for your trading style. With a beta of 1.6 versus the .SPX, the stock can and does make large price swings on a regular basis that skilled traders can exploit for possible gains. Here's a look at the current price cycles in CCJ now (Figure 1). |

|
| FIGURE 1: CCJ, DAILY. CCJ tends to make frequent, tradable swings. Wise price cycle analysis may be able to help traders better stay on the right side of many of these moves. |
| Graphic provided by: Sentient Trader. |
| |
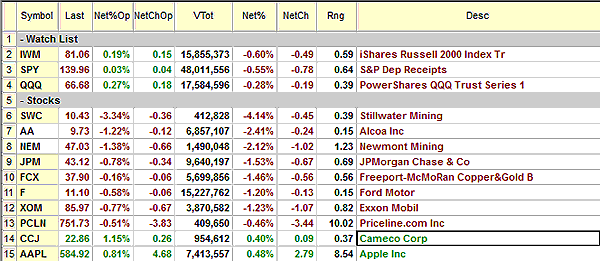
| One quick look at CCJ's price chart easily confirms the volatility and/or trending capability of this stock; from mid-December 2011 to late February 2012, the stock rocketed nearly $10 higher -- a nearly 55% gain in only nine weeks. Then, after making a major swing high in February 2012, the stock proceeded to plummet by nearly 25% by early April 2012. Since making that major multicycle low, the stock is up another $4 -- almost 20% -- in just three and a half weeks. Imagine being able to get on the right side of all of these market swings, riding them to consistent profits over time; of course, no one can ever hope to have no losing trades, drawdowns, or times of frustration as a trader, but it does appear that the wise use of price cycle analysis can be a potent trading tool that can keep market players in tune with the most probable future path of market prices, no matter what stocks or futures contracts they may trade. According to the particular Sentient Trader (ST) analysis I used to locate the price cycles on the chart, the April 10, 2012, low was a fairly important turning point for CCJ, seeing that as many as six different cycles all bottomed at the same time. The move higher out of that major cyclical low has been fairly smooth and swift, with CCJ now already within its red time/price projection (TP zone) box. The ST software is suggesting that CCJ may rise as high as 25.39 by no later than May 8, 2012, and the stock has already made solid gains as it approaches that red TP zone; the recent gap higher is also of interest -- it could possibly be a breakaway gap, the kind seen at the onset of many large trend moves. Of greater interest, perhaps, is the big-picture bullishness depicted here. Should CCJ make a near-term swing high and then pull back, it's likely to find plenty of support between 20.00 and 21.00, as the green TP zone and 18-week trendline will attest to. The anticipated pullback should occur sometime between now and May 25, 2012, based on current ST analysis. Currently, the broad US markets are all over the place with small caps faring worse than large caps; fortunately for CCJ traders, this stock is noncorrelated with the .SPX (with a correlation score of only 0.08 over the past three years), so CCJ traders probably don't need to factor a lot of broad market timing into their trading decisions -- most of the time. See Figure 2. |

|
| FIGURE 2: CCJ. Shares of Cameco Corp. were up (intraday basis) on May 2, 2012, on a day when most other stocks were down. |
| Graphic provided by: TradeStation. |
| |
| Playing CCJ here might involve nothing more complicated than buying intraday pullbacks to key support levels (floor trader pivots, major moving averages, Fibonacci confluence zones, and so on) in an attempt to capitalize on this stock's current upward momentum. Of course, if the stock makes a swing high soon and then pulls back toward the 18-week trendline, that could form the foundation from which to start scanning for low-risk intraday long entry points in anticipation of another tradable thrust higher, one that might last a few days or even a few weeks, depending on market conditions at that time. Always use risk control and know when to get in a trade, stay in a trade, and when to get out of your trades, win or lose. |
Donald W. Pendergast is a financial markets consultant who offers specialized services to stock brokers and high net worth individuals who seek a better bottom line for their portfolios.
| Title: | Writer, market consultant |
| Company: | Linear Trading Systems LLC |
| Jacksonville, FL 32217 | |
| Phone # for sales: | 904-239-9564 |
| E-mail address: | lineartradingsys@gmail.com |
Traders' Resource Links | |
| Linear Trading Systems LLC has not added any product or service information to TRADERS' RESOURCE. | |
Click here for more information about our publications!
PRINT THIS ARTICLE

Request Information From Our Sponsors
- StockCharts.com, Inc.
- Candle Patterns
- Candlestick Charting Explained
- Intermarket Technical Analysis
- John Murphy on Chart Analysis
- John Murphy's Chart Pattern Recognition
- John Murphy's Market Message
- MurphyExplainsMarketAnalysis-Intermarket Analysis
- MurphyExplainsMarketAnalysis-Visual Analysis
- StockCharts.com
- Technical Analysis of the Financial Markets
- The Visual Investor
- VectorVest, Inc.
- Executive Premier Workshop
- One-Day Options Course
- OptionsPro
- Retirement Income Workshop
- Sure-Fire Trading Systems (VectorVest, Inc.)
- Trading as a Business Workshop
- VectorVest 7 EOD
- VectorVest 7 RealTime/IntraDay
- VectorVest AutoTester
- VectorVest Educational Services
- VectorVest OnLine
- VectorVest Options Analyzer
- VectorVest ProGraphics v6.0
- VectorVest ProTrader 7
- VectorVest RealTime Derby Tool
- VectorVest Simulator
- VectorVest Variator
- VectorVest Watchdog
