HOT TOPICS LIST
- MACD
- Fibonacci
- RSI
- Gann
- ADXR
- Stochastics
- Volume
- Triangles
- Futures
- Cycles
- Volatility
- ZIGZAG
- MESA
- Retracement
- Aroon
INDICATORS LIST
LIST OF TOPICS
PRINT THIS ARTICLE
by Koos van der Merwe
The maxim is "Sell in May and go away." Here is one stock that is suggesting the opposite.
Position: Accumulate
Koos van der Merwe
Has been a technical analyst since 1969, and has worked as a futures and options trader with First Financial Futures in Johannesburg, South Africa.
PRINT THIS ARTICLE
TRIANGLES
A Buy In May?
05/07/12 09:04:56 AMby Koos van der Merwe
The maxim is "Sell in May and go away." Here is one stock that is suggesting the opposite.
Position: Accumulate
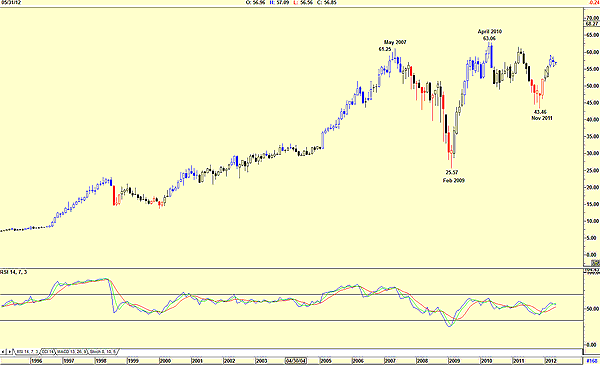
| Royal Bank of Canada (RBC) followed the financial world with the collapse of May 2007, as the mortgage-backed crisis punished financial institutions throughout North America. Figure 1 shows this. |

|
| FIGURE 1: ROYAL BANK OF CANADA, MONTHLY |
| Graphic provided by: AdvancedGET. |
| |
| The chart is a monthly chart of Royal Bank of Canada and shows how the price dropped from a high of $61.25 in May 2007 to the low of $25.57 by February 2009. From that level it rose to $63.06 by April 2010. Since then, it traded in a range falling as low as $43.46 by November 2011 before recovering once again. The relative strength index (RSI) is still suggesting a positive trend. |

|
| FIGURE 2: ROYAL BANK OF CANADA, DAILY |
| Graphic provided by: AdvancedGET. |
| |
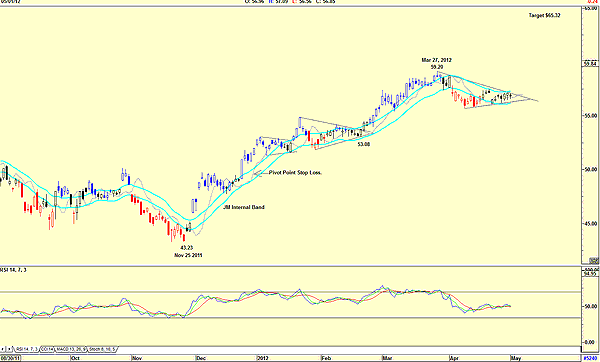
| The daily chart (Figure 2) shows how the price rose from a low of $43.23 on November 25, 2011, to a high of $59.20 by March 2012. From that level it is forming another equilateral triangle, which is suggesting a target of $65.32 when the upper trendline of the triangle is penetrated. The price is still trading with the JM internal band, and a break above the upper trendline will confirm a buy signal. The JM internal band is a 15-period moving average offset by 2% positive and 2% negative. Do note that the XTL trend indicator that colors the price candlestick bars is still black, which is neutral. Blue suggests a buy and red suggests a sell. I would not be a buyer of RBC at the moment, but it is a stock that is now on our watchlist, waiting for a definite buy signal. |
Has been a technical analyst since 1969, and has worked as a futures and options trader with First Financial Futures in Johannesburg, South Africa.
| Address: | 3256 West 24th Ave |
| Vancouver, BC | |
| Phone # for sales: | 6042634214 |
| E-mail address: | petroosp@gmail.com |
Click here for more information about our publications!
PRINT THIS ARTICLE

Request Information From Our Sponsors
- StockCharts.com, Inc.
- Candle Patterns
- Candlestick Charting Explained
- Intermarket Technical Analysis
- John Murphy on Chart Analysis
- John Murphy's Chart Pattern Recognition
- John Murphy's Market Message
- MurphyExplainsMarketAnalysis-Intermarket Analysis
- MurphyExplainsMarketAnalysis-Visual Analysis
- StockCharts.com
- Technical Analysis of the Financial Markets
- The Visual Investor
- VectorVest, Inc.
- Executive Premier Workshop
- One-Day Options Course
- OptionsPro
- Retirement Income Workshop
- Sure-Fire Trading Systems (VectorVest, Inc.)
- Trading as a Business Workshop
- VectorVest 7 EOD
- VectorVest 7 RealTime/IntraDay
- VectorVest AutoTester
- VectorVest Educational Services
- VectorVest OnLine
- VectorVest Options Analyzer
- VectorVest ProGraphics v6.0
- VectorVest ProTrader 7
- VectorVest RealTime Derby Tool
- VectorVest Simulator
- VectorVest Variator
- VectorVest Watchdog
