

HOT TOPICS LIST
- MACD
- Fibonacci
- RSI
- Gann
- ADXR
- Stochastics
- Volume
- Triangles
- Futures
- Cycles
- Volatility
- ZIGZAG
- MESA
- Retracement
- Aroon
INDICATORS LIST
LIST OF TOPICS
PRINT THIS ARTICLE
by Alan R. Northam
This statistical analysis shows that the Dow Jones Industrial Average is very close to an intermediate-term trend reversal from up to down.
Position: N/A
Alan R. Northam
Alan Northam lives in the Dallas, Texas area and as an electronic engineer gave him an analytical mind from which he has developed a thorough knowledge of stock market technical analysis. His abilities to analyze the future direction of the stock market has allowed him to successfully trade of his own portfolio over the last 30 years. Mr. Northam is now retired and trading the stock market full time. You can reach him at inquiry@tradersclassroom.com or by visiting his website at http://www.tradersclassroom.com. You can also follow him on Twitter @TradersClassrm.
PRINT THIS ARTICLE
STATISTICS
DJIA Reversal On The Horizon
05/04/12 08:31:10 AMby Alan R. Northam
This statistical analysis shows that the Dow Jones Industrial Average is very close to an intermediate-term trend reversal from up to down.
Position: N/A
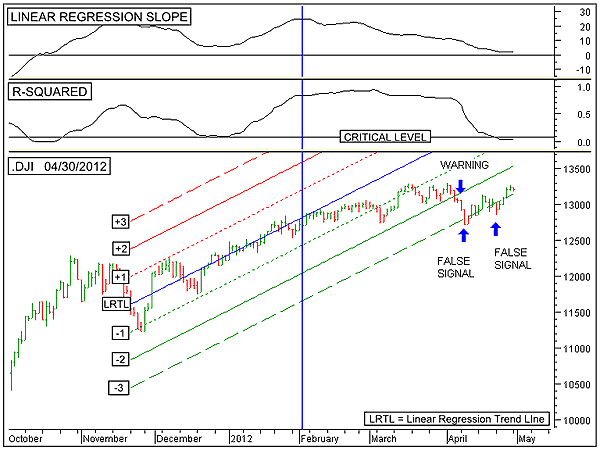
| Figure 1 shows the daily bar chart of the Dow Jones Industrial Average (DJIA) from October 2011 onward. The vertical blue line is drawn on the chart from the most recent highest peak of the linear regression slope indicator. This peak represents the maximum point of price acceleration. The linear regression trendline (blue line) is drawn from this point backward in time over the preceding 50 trading sessions representing the intermediate-term trend. The linear regression trendline is then extended to the right of the vertical blue line. The vertical blue line would have been originally drawn in early February, representing the future price trend. The +1 and -1 sigma channel lines, the +2 and -2 sigma channel lines, and the +3 and -3 sigma channel lines are also drawn in like manner. The 50-session linear regression slope indicator is shown in the top panel and the R-squared indicator in the middle panel. |
|
| FIGURE 1: .DJI, DAILY. This chart shows the daily price chart of the DJIA in the bottom panel along with its 50-day linear regression line. The linear regression slope indicator is shown in the top panel, and the R-squared indicator is shown in the middle. |
| Graphic provided by: MetaStock. |
| |
| The linear regression slope indicator in the top panel shows when the intermediate-term trend begins and ends as well as how fast price is accelerating or decelerating. Note that this indicator crossed above its zero line in October 2011, indicating a reversal in trend over the intermediate-term trend from down to up. From October onward, this indicator shows two periods of price acceleration when it was moving upward. This indicator also shows two periods of price deceleration when it moved downward with the second period still in progress. Once this indicator moves back below its zero line, it will be an indication that the intermediate-term trend has reversed from an uptrend to a downtrend. |
| The R-squared indicator in the third window is a measure of the strength of the trend. The scale of the R-squared indicator moves from zero or 0% to 1 or 100%. When this indicator is at 0.0, it indicates that all price movement is random and there is no trend. When this indicator is at 1.0, it indicates that all price movement is trending. When this indicator is at 0.5, it indicates that 50% of the price movement represents the trend and 50% of the price movement is random. Currently, this indicator is reading 0.04, indicating that only 4% of the price movement is trending and the other 96% of the price movement is random. Thus, it is fair to say that the uptrend is extremely weak. There is another statistical measurement on the R-squared indicator in the form of the critical level. The critical level line moves either up or down, based upon the lookback period. For a 50-session lookback period, this line is drawn horizontally at 0.08. When the R-squared indicator is above this line, there exists a statistical significance of a 95% confidence level that the trend will continue. When the R-squared indicator is below the critical level, that statistical significance no longer exists. Note that the R-squared indicator is currently below this critical level and thus it is fair to say that there no longer exists a statistically significant uptrend. |
| Looking at the price chart in the bottom panel shows that from early February 2012 onward, price started to fall away from the linear regression trendline (upsloping blue line). This falling away is known at price deceleration. Price deceleration normally is a sign of a weakening trend and a sign that the uptrend has just about run its course and a reversal in trend is most likely just ahead. Note that in mid-April, price moved below its -2 sigma channel line sending a warning of a reversal in trend is ahead. An actual reversal signal is given when price moves below the -3 sigma channel line. Note that in April there were two false signals of a trend reversal. Note also that from mid-April onward, price has been hugging the -3 sigma channel line. Thus, it would not take much for price to move below it to again signal a reversal. |
| This statistical analysis of the DJIA shows that while the intermediate-term trend continues, price has been decelerating since early February, an indication that a reversal to a downtrend could be just ahead. This analysis also shows that there is no longer a statistical significance that the uptrend will continue. This analysis has also shown that there has already been two false signals, indicating a reversal in trend from up to down. Finally, this analysis has shown that price continues to hug the -3 sigma channel line, and it would not take much for a third and perhaps final signal to be given that a reversal in trend has occurred. |
Alan Northam lives in the Dallas, Texas area and as an electronic engineer gave him an analytical mind from which he has developed a thorough knowledge of stock market technical analysis. His abilities to analyze the future direction of the stock market has allowed him to successfully trade of his own portfolio over the last 30 years. Mr. Northam is now retired and trading the stock market full time. You can reach him at inquiry@tradersclassroom.com or by visiting his website at http://www.tradersclassroom.com. You can also follow him on Twitter @TradersClassrm.
| Garland, Tx | |
| Website: | www.tradersclassroom.com |
| E-mail address: | inquiry@tradersclassroom.com |
Click here for more information about our publications!
PRINT THIS ARTICLE

Request Information From Our Sponsors
- StockCharts.com, Inc.
- Candle Patterns
- Candlestick Charting Explained
- Intermarket Technical Analysis
- John Murphy on Chart Analysis
- John Murphy's Chart Pattern Recognition
- John Murphy's Market Message
- MurphyExplainsMarketAnalysis-Intermarket Analysis
- MurphyExplainsMarketAnalysis-Visual Analysis
- StockCharts.com
- Technical Analysis of the Financial Markets
- The Visual Investor
- VectorVest, Inc.
- Executive Premier Workshop
- One-Day Options Course
- OptionsPro
- Retirement Income Workshop
- Sure-Fire Trading Systems (VectorVest, Inc.)
- Trading as a Business Workshop
- VectorVest 7 EOD
- VectorVest 7 RealTime/IntraDay
- VectorVest AutoTester
- VectorVest Educational Services
- VectorVest OnLine
- VectorVest Options Analyzer
- VectorVest ProGraphics v6.0
- VectorVest ProTrader 7
- VectorVest RealTime Derby Tool
- VectorVest Simulator
- VectorVest Variator
- VectorVest Watchdog