HOT TOPICS LIST
- MACD
- Fibonacci
- RSI
- Gann
- ADXR
- Stochastics
- Volume
- Triangles
- Futures
- Cycles
- Volatility
- ZIGZAG
- MESA
- Retracement
- Aroon
INDICATORS LIST
LIST OF TOPICS
PRINT THIS ARTICLE
by Donald W. Pendergast, Jr.
The recent shock selloff in shares of Republic Services managed to take out two important uptrend lines after leaving a giant open gap for technicians to analyze.
Position: N/A
Donald W. Pendergast, Jr.
Donald W. Pendergast is a financial markets consultant who offers specialized services to stock brokers and high net worth individuals who seek a better bottom line for their portfolios.
PRINT THIS ARTICLE
CHART ANALYSIS
More Selling Due For RSG After Plunge?
05/04/12 08:23:33 AMby Donald W. Pendergast, Jr.
The recent shock selloff in shares of Republic Services managed to take out two important uptrend lines after leaving a giant open gap for technicians to analyze.
Position: N/A
| Many times, a shock selloff in a stock is triggered by something like a bad earnings release, a corporate scandal, declining earnings, or a loss of market share. In other words, there is usually a real and definable event that causes investors and traders to react by pushing the sell button, and with great haste. But it's interesting to note that in many cases, a stock that is destined to sell off sharply will very often give advance warning that distribution is under way well before the plunge actually occurs. Here's a look at the recent, freefall price action in shares of Republic Services (RSG) along with some thoughtful analysis of what may be shaping up next for this large-cap issue. |

|
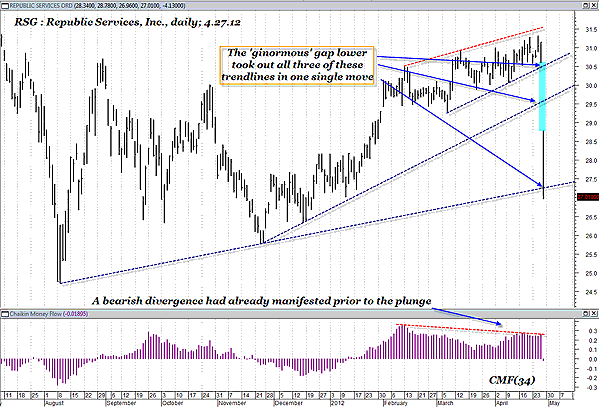
| FIGURE 1: RSG, DAILY. Nearly four months worth of gains in RSG were wiped out in a single trading session on April 26, 2012. Despite the size of the plunge, wise traders may find that waiting for a minor pullback may offer a lower-risk shorting opportunity as compared to shorting right away. |
| Graphic provided by: MetaStock. |
| |
| All it takes is a quick glance at RSG's daily chart (Figure 1) to realize that this is a highly volatile, explosive stock that can change directions on the proverbial dime. Yet, even high-beta stocks can and do establish meaningful, long-term trends that aggressive investors and traders can take advantage of. In the case of RSG, it had already established three significant trendlines, one of which had its beginning back in early August 2011. The two longer-term trendlines help provide a useful big-picture perspective to traders as the stock eventually inched up to its April 26, 2012, high of 31.14, allowing them the opportunity to identify potential trade setups along its route toward higher prices. The most recent trendline would have helped traders stay with the trending move that launched in early March 2012. However, at the same time that RSG was moving on up, the 34-period Chaikin money flow histogram (CMF)(34) was already telegraphing that a bearish price/money flow divergence was under way, one that might ultimately resolve itself with a substantial corrective move to lower prices. The divergence became most noticeable during March and April 2012 and would have alerted the smart money that the probabilities of a correction were increasing dramatically with each passing day. In reality, though, such a leading indicator can only help warn traders and investors to begin to take various protective measures (such as buying puts, running closer stops, scaling out or selling out of long positions entirely, for starters) but cannot normally be used with any degree of success as a specific buy/sell or market timing trigger as a standalone indicator. See Figure 2. |

|
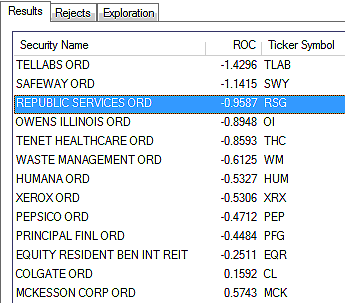
| FIGURE 2: RELATIVE STRENGTH. These are the weak relative strength large-cap stocks firing RMO (Rahul Mohindar) swing sell signals for April 27, 2012. |
| Graphic provided by: MetaStock. |
| Graphic provided by: MetaStock Explorer. |
| |
| With the mega, unexpected shock selloff of April 26, 2012, traders are now left with the question: Should we just go short right now and capitalize on this powerful bearish momentum, or should we wait for a bounce higher before trying to go short this stock? While there is no cut-and-dried answer to that question, it's important to understand the technical dynamics that surround such a chart pattern: 1. There is a very high probability that the large open gap caused by the selloff was indeed an exhaustion gap, one that implies that the recent plunge was only the first stage in an ongoing decline that may go significantly lower. 2. Near term, there is also a very high probability that RSG will bounce higher, thus offering a lower-risk short entry in the next few sessions. Note that although the lower trendline was breached on a daily close, the penetration was minor, implying that many traders in this stock still have a great deal of respect for this major support barrier. One simple way to consider shorting this stock might to monitor the trusty relative strength index (RSI)(10) on RSG's daily chart. If you see the indicator rise above 70, wait for the first daily close back below 70 and then go short at the next session's open, or perhaps on a drop below the prior trading session's low. If filled on the trade, run a two-bar trailing stop of the daily highs until the final stopout, win or lose. It will also be important to monitor price action at the lower trendline, should the stock proceed to drop on such a short setup. It is important to realize that the stock might even try to bounce high enough to attempt a closing of the large gap; many times a stock will reverse direction right after a major gap is closed, so that can be another possible short setup to monitor for savvy, experienced traders. However you choose to play RSG, be sure to use modest position sizing and faithfully update your stop-loss orders at the close of each trading session. |
Donald W. Pendergast is a financial markets consultant who offers specialized services to stock brokers and high net worth individuals who seek a better bottom line for their portfolios.
| Title: | Writer, market consultant |
| Company: | Linear Trading Systems LLC |
| Jacksonville, FL 32217 | |
| Phone # for sales: | 904-239-9564 |
| E-mail address: | lineartradingsys@gmail.com |
Traders' Resource Links | |
| Linear Trading Systems LLC has not added any product or service information to TRADERS' RESOURCE. | |
Click here for more information about our publications!
PRINT THIS ARTICLE

Request Information From Our Sponsors
- VectorVest, Inc.
- Executive Premier Workshop
- One-Day Options Course
- OptionsPro
- Retirement Income Workshop
- Sure-Fire Trading Systems (VectorVest, Inc.)
- Trading as a Business Workshop
- VectorVest 7 EOD
- VectorVest 7 RealTime/IntraDay
- VectorVest AutoTester
- VectorVest Educational Services
- VectorVest OnLine
- VectorVest Options Analyzer
- VectorVest ProGraphics v6.0
- VectorVest ProTrader 7
- VectorVest RealTime Derby Tool
- VectorVest Simulator
- VectorVest Variator
- VectorVest Watchdog
- StockCharts.com, Inc.
- Candle Patterns
- Candlestick Charting Explained
- Intermarket Technical Analysis
- John Murphy on Chart Analysis
- John Murphy's Chart Pattern Recognition
- John Murphy's Market Message
- MurphyExplainsMarketAnalysis-Intermarket Analysis
- MurphyExplainsMarketAnalysis-Visual Analysis
- StockCharts.com
- Technical Analysis of the Financial Markets
- The Visual Investor
