HOT TOPICS LIST
- MACD
- Fibonacci
- RSI
- Gann
- ADXR
- Stochastics
- Volume
- Triangles
- Futures
- Cycles
- Volatility
- ZIGZAG
- MESA
- Retracement
- Aroon
INDICATORS LIST
LIST OF TOPICS
PRINT THIS ARTICLE
by Gary Grosschadl
Two successive topping formations gave plenty of warning of trouble ahead despite analyst hoopla. Now the stock struggles like a drowning man as it dips under the all-important 200-day EMA for a second time.
Position: N/A
Gary Grosschadl
Independent Canadian equities trader and technical analyst based in Peterborough
Ontario, Canada.
PRINT THIS ARTICLE
CHART ANALYSIS
Bearish Implications for ESS Technology
06/10/02 01:47:14 PMby Gary Grosschadl
Two successive topping formations gave plenty of warning of trouble ahead despite analyst hoopla. Now the stock struggles like a drowning man as it dips under the all-important 200-day EMA for a second time.
Position: N/A
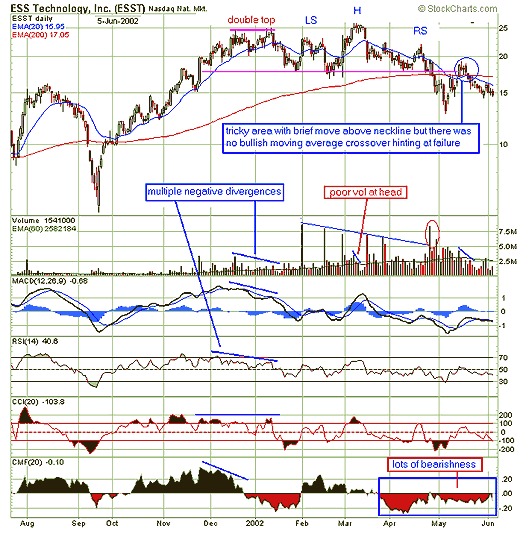
| Looking at the chart below, ESS Technology (ESST) showed the first sign of trouble, after a most impressive rise, when it was halted by a double top formation. This rocket finally ran out of fuel at the $25 level. Note the multiple divergences forming with the second top. The lower volume was a big tip-off that bullishness was waning. A vicious little correction ensued and the stock dropped back down to the $18 level. This was the likely support level indicated by pattern measurement and also happened to be the midpoint of the previous large candlestick. This level became very important for the next topping formation. |
| The next four months were followed by choppy action as the second top took the form of a head and shoulders pattern. The shoulder symmetry was not ideal, however the neckline was very well placed, coinciding with the previous December correction low where the double top breakdown ended. The volume spikes followed the proper pattern of higher volume on the left side, relatively poor volume at the head, and then bigger volume at neckline challenge. The volume spikes show traders' sentiment well and it is interesting that the pattern of volume spikes told the story better than the underlying volume trend. Volume escalated as it should when the neckline was challenged on the right shoulder breakdown. As the chart shows, this area was a crucial point, not only because of the neckline failure, but also because the stock was heading below the all-important 200-day moving average (I prefer the exponential moving average, EMA). When a stock battles this long-term moving average, it is closely watched by institutional traders. A move under the 200-day EMA often prompts selling pressure as it is seen as an important change in trend. |

|
| Graphic provided by: stockcharts.com. |
| |
| ESST found support at $13, then pulled back to the breakdown area of the previous neckline. This is where it gets tricky. A rise above the neckline is deemed to invalidate the bearish implication of the head and shoulders top and this would have whipsawed some traders. This is where shorter-term traders would have been aided by waiting just a little longer for additional confirmation. One justification could have been watching to see if the much shorter-term moving average -- the 20-day EMA-- would actually do a bullish cross of the 200-day EMA. The subsequent failure of this to occur hinted at a possible resumption of the downtrend. Candlestick watchers would have also seen trouble brewing as two bearish candles quickly appeared - first a shooting star and then a bearish engulfing pattern. That was enough to start another downleg below the 200-day EMA. |
| So what is likely in store now? The stock may hesitate briefly at this previous congestion zone of $15 and then continue to descend in bearish territory. The next two possible support areas are $13 and $10. Note the stock's relationship to the 20-day EMA. During the strong uptrend, it was nicely supported by this moving average line. During the rather long topping phase there was no clear direction as this line whipsawed back and forth reflecting the choppy action. Now the 20-day EMA is forming a distinctive downslope with ESST spending most of its time under it. This certainly suggests a bearish change in trend. Stocks in a downtrend often fail at the 20-day EMA line (bear rally) and this will be something to monitor going forward. Although not shown on this chart, ESST is on the verge of another bearish moving average crossover. The 50-day EMA is about to fall below the 200-day EMA; another wave to hit this struggling swimmer. Should the stock pull a surprise move to the upside, watch for a move above the 200-day EMA, but I wouldn't hold my breath. |
Independent Canadian equities trader and technical analyst based in Peterborough
Ontario, Canada.
| Website: | www.whatsonsale.ca/financial.html |
| E-mail address: | gwg7@sympatico.ca |
Click here for more information about our publications!
Comments
Date: 06/25/02Rank: 4Comment:

Request Information From Our Sponsors
- StockCharts.com, Inc.
- Candle Patterns
- Candlestick Charting Explained
- Intermarket Technical Analysis
- John Murphy on Chart Analysis
- John Murphy's Chart Pattern Recognition
- John Murphy's Market Message
- MurphyExplainsMarketAnalysis-Intermarket Analysis
- MurphyExplainsMarketAnalysis-Visual Analysis
- StockCharts.com
- Technical Analysis of the Financial Markets
- The Visual Investor
- VectorVest, Inc.
- Executive Premier Workshop
- One-Day Options Course
- OptionsPro
- Retirement Income Workshop
- Sure-Fire Trading Systems (VectorVest, Inc.)
- Trading as a Business Workshop
- VectorVest 7 EOD
- VectorVest 7 RealTime/IntraDay
- VectorVest AutoTester
- VectorVest Educational Services
- VectorVest OnLine
- VectorVest Options Analyzer
- VectorVest ProGraphics v6.0
- VectorVest ProTrader 7
- VectorVest RealTime Derby Tool
- VectorVest Simulator
- VectorVest Variator
- VectorVest Watchdog
