HOT TOPICS LIST
- MACD
- Fibonacci
- RSI
- Gann
- ADXR
- Stochastics
- Volume
- Triangles
- Futures
- Cycles
- Volatility
- ZIGZAG
- MESA
- Retracement
- Aroon
INDICATORS LIST
LIST OF TOPICS
PRINT THIS ARTICLE
by Mike Carr, CMT
Traders often look for complex strategies but simple could be profitable, and this simple idea points to further gains in stocks.
Position: Buy
Mike Carr, CMT
Mike Carr, CMT, is a member of the Market Technicians Association, and editor of the MTA's newsletter, Technically Speaking. He is also the author of "Smarter Investing in Any Economy: The Definitive Guide to Relative Strength Investing," and "Conquering the Divide: How to Use Economic Indicators to Catch Stock Market Trends."
PRINT THIS ARTICLE
MACD
Simple Strategy With 80% Winners
05/02/12 10:33:15 AMby Mike Carr, CMT
Traders often look for complex strategies but simple could be profitable, and this simple idea points to further gains in stocks.
Position: Buy
| Trading systems vary in complexity from single indicators to rules developed using multivariable calculus and grounded in math defined by chaos theory. Individuals should consider that they generally have limited time to devote to studying the markets, and simple indicators might be best to use. Another benefit of single indicators is that if they were successful in the past, they are more likely to work in the future. More complex strategies run the risk of being curve fit, which means they are designed to perfectly match the past. After choosing indicators, the next decision to make is what time frame to trade in. Here, individual traders need to consider what their personal edge in the markets will be. Daytraders are now competing against high-frequency trading (HFT) firms, which have access to real-time market data and can execute both sides of trades in seconds. HFT firms measure their reaction times in milliseconds and they enter thousands of orders a day, most of which are canceled before they are executed. These are advantages that are difficult for individuals to overcome. Rather than trying to compete with firms that have invested millions of dollars in trading infrastructure, individuals should consider trading with longer-term data. Weekly data is surprisingly profitable. |
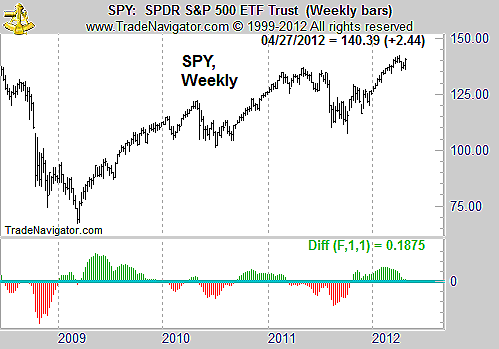
| A very simple trading system is to apply moving average convergence/divergence (MACD) to the broad stock market using weekly data. Default indicators are used for MACD, and testing on SPY, an exchange traded fund (ETF) that tracks the Standard & Poor's 500, shows that 81.8% of the 11 trades since 1990 would be winners. This strategy is invested about 63% of the time and is long only when the MACD histogram is positive. The average trade gains about 20% and risk, measured by drawdown, is very low (about 10% of the total system profits). See Figure 1. |

|
| FIGURE 1: MACD ON SPY. The MACD on SPY is bullish at the end of April, although the indicator is close to turning negative. |
| Graphic provided by: Trade Navigator. |
| |
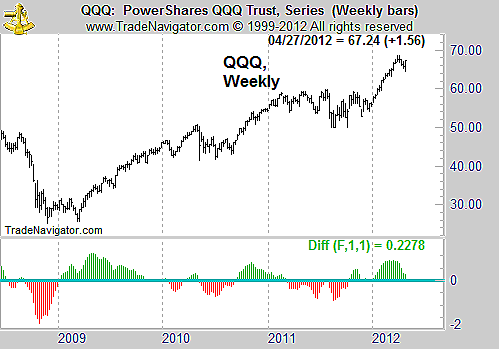
| This strategy, being long the SPY when MACD is positive, is also profitable using daily data. Only about 40% of the daily trades are winners; however, the average profits are significantly greater than the average loss. The profit factor is 1.64 with daily data, compared to 9.90 for weekly data. Using intraday data, profits are still possible but as trading costs mount, the profit factor continues to decline. With futures, the profit factor jumps to 3.96 for the S&P 500 futures contract and 3.18 on the emini S&P 500. Trading QQQ, an ETF that tracks the NASDAQ 100, the profit factor reaches an almost unbelievable 36.42 on a long-only strategy. See Figure 2. |

|
| FIGURE 2: MACK ON NASDAQ 100. The MACD on the NASDAQ 100 is bullish, although it is very close to turning negative. |
| Graphic provided by: Trade Navigator. |
| |
| Traders should be focused on making money rather than chasing excitement in the markets, although many traders ignore this idea and trade hunches rather than relying on more disciplined approaches. Weekly data and MACD could provide an important input into any trading strategy. Long trades taken only if MACD is positive will have a higher likelihood of success. More complex strategies can also be traded successfully, but traders should try to keep their strategies as simple as possible. It doesn't really get much simpler than using just a single indicator with default parameters and weekly data. But traders could use this simple idea as the cornerstone of a system for long-term profits. |
Mike Carr, CMT, is a member of the Market Technicians Association, and editor of the MTA's newsletter, Technically Speaking. He is also the author of "Smarter Investing in Any Economy: The Definitive Guide to Relative Strength Investing," and "Conquering the Divide: How to Use Economic Indicators to Catch Stock Market Trends."
| Website: | www.moneynews.com/blogs/MichaelCarr/id-73 |
| E-mail address: | marketstrategist@gmail.com |
Click here for more information about our publications!
Comments
Date: 05/04/12Rank: 5Comment:
Date: 05/14/12Rank: 3Comment: Would you please perform a backtest of the author s strategy in order to validate his claim? I have tested his strategy myself using TradeStation s EasyLanguage and Worden data, along with several strategy variations, and have not been able to duplicate his results. In fact, my testing indicates the strategy is mediocre at best.
Since last week, I have been in contact with Mr. Carr via email in hopes of determining why there is such a disparity between our test results, but the issue still remains unresolved.
Thank you.
Name: Donald Byrge
Subscriber ID: 21714
Email: dhbyrge@gmail.com
Phone: (229) 386-8142
Date: 07/06/12Rank: 5Comment: Thanks for a great article about an indicator I understand!
Date: 07/15/12Rank: 5Comment:
Date: 04/03/13Rank: 4Comment:

|

Request Information From Our Sponsors
- StockCharts.com, Inc.
- Candle Patterns
- Candlestick Charting Explained
- Intermarket Technical Analysis
- John Murphy on Chart Analysis
- John Murphy's Chart Pattern Recognition
- John Murphy's Market Message
- MurphyExplainsMarketAnalysis-Intermarket Analysis
- MurphyExplainsMarketAnalysis-Visual Analysis
- StockCharts.com
- Technical Analysis of the Financial Markets
- The Visual Investor
- VectorVest, Inc.
- Executive Premier Workshop
- One-Day Options Course
- OptionsPro
- Retirement Income Workshop
- Sure-Fire Trading Systems (VectorVest, Inc.)
- Trading as a Business Workshop
- VectorVest 7 EOD
- VectorVest 7 RealTime/IntraDay
- VectorVest AutoTester
- VectorVest Educational Services
- VectorVest OnLine
- VectorVest Options Analyzer
- VectorVest ProGraphics v6.0
- VectorVest ProTrader 7
- VectorVest RealTime Derby Tool
- VectorVest Simulator
- VectorVest Variator
- VectorVest Watchdog
