HOT TOPICS LIST
- MACD
- Fibonacci
- RSI
- Gann
- ADXR
- Stochastics
- Volume
- Triangles
- Futures
- Cycles
- Volatility
- ZIGZAG
- MESA
- Retracement
- Aroon
INDICATORS LIST
LIST OF TOPICS
PRINT THIS ARTICLE
by Matt Blackman
Point & figure charting evolved as a way to quickly chart stocks, bonds, and commodities by hand long before the day of the computer. But does this technique offer value to the computerized trader today?
Position: N/A
Matt Blackman
Matt Blackman is a full-time technical and financial writer and trader. He produces corporate and financial newsletters, and assists clients in getting published in the mainstream media. He is the host of TradeSystemGuru.com. Matt has earned the Chartered Market Technician (CMT) designation. Find out what stocks and futures Matt is watching on Twitter at www.twitter.com/RatioTrade
PRINT THIS ARTICLE
POINT & FIGURE
Point & Figure For The Computerized Trader
05/02/12 09:11:45 AMby Matt Blackman
Point & figure charting evolved as a way to quickly chart stocks, bonds, and commodities by hand long before the day of the computer. But does this technique offer value to the computerized trader today?
Position: N/A
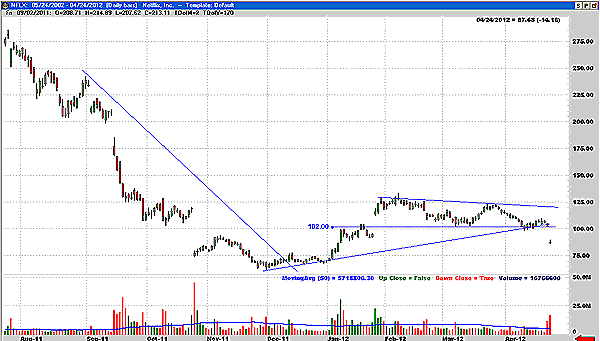
| Trading shares in DVD and digital download movie rental company NetFlix (NFLX) can be likened to riding a wild bronco. Over the last three years, it has bucked, jumped, and dipped as well as any top-rated bull on the rodeo circuit. Between early December 2008 and July 2011, those hardy enough to hold on enjoyed a 10-bag return as the stock moved from below $25 to more than $300. But then the stock rapidly morphed from a parabolic rocket to a lead balloon, losing more than 80% before pulling out of its death spiral in early 2012. See Figure 1. |
| So what does the future hold for the stock? Has it put in a bottom, or is it just another example of a dead-cat bouncer destined for oblivion? For the answer to these questions, let's step back in both focus and time to a method of technical analysis that was developed long before the birth of the computer, known as point & figure charting. |

|
| FIGURE 1: NFLX, DAILY. NFLX shows the big drop and recovery with key support just above $100 that was broken after the release of disappointing earnings on April 23, which also breached uptrend support rising from the December 2011 bottom. |
| Graphic provided by: Trade Navigator. |
| |
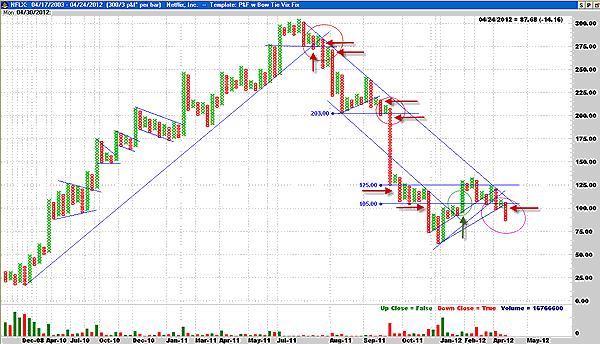
| According to Jeremy du Plessis, head of technical analysis for Updata.co.uk and author of the most thorough modern-day book on the subject entitled "The Definitive Guide To Point And Figure" (Harriman House 2011), because P&F charts are not time dependent, they can show you one thing only -- "uncontaminated supply and demand." New plot points are only added when price changes more than the preset amount specified by box size. If a stock gets mired in a trading range for an extended period of time, no new action is recorded on the chart. "One of the greatest advantages of point & figure charts is the unambiguity of the buy and sell signals they generate," according to du Plessis. We can see this principle demonstrated in Figure 2. During the powerful NetFlix rally from December 2008 to July 2011, note the number of bull flag and pennant patterns. Buy signals are generated when price breaks above the top line of the patterns. |
| In this chart we focus on sell signals (red arrows). The first major signal was generated in mid-July 2011 as price broke below horizontal support at $275 -- first a minor breach followed by a major break. Traders who ignored these signals got another just below $225, followed by another at $203, by which time the stock was locked in a strong downtrend. NFLX did generate a buy signal (green arrow) as it broke above $105, but the trade would have been a loser if the trader relied solely on P&F end-of-day signals. Finally in late April 2012, there was another sell signal as $105 was decisively broken to the downside. |

|
| FIGURE 2: P&F. Here's a 300/3 point & figure chart, which means that price must move three points before being recorded and only reversals of three points or more are recorded. Up moves are recorded with green Xs and down with red Os. |
| Graphic provided by: Trade Navigator. |
| |
| A major component of trading and investing success is to have signals that are as simple and easy to read as possible. P&F allows users to plot their preferred time-in-trade, whether it be tick charts or larger end-of-day moves such as five or 10 points with box reversal sizes of 5 or 10. The trick is to choose box sizes that provide you with the clearest picture and most reliable buy & sell signals. In the good old days, charts were constructed by hand. Nowadays, it's as easy as the push of a few buttons with the right software. According to du Plessis, P&F chart software should construct charts quickly and allow the user to easily spot important chart patterns along with buy & sell points in different time frames combined with the ability to quickly add your favorite customized technical indicators. So what does the future hold for NFLX and has a bottom been put in? Figure 2 shows a stock that is still locked in a strong downtrend, and much time and sideways action will be needed before a bottom can be confirmed. And if the December 2011 low near $60 is taken out, look out below! |
Matt Blackman is a full-time technical and financial writer and trader. He produces corporate and financial newsletters, and assists clients in getting published in the mainstream media. He is the host of TradeSystemGuru.com. Matt has earned the Chartered Market Technician (CMT) designation. Find out what stocks and futures Matt is watching on Twitter at www.twitter.com/RatioTrade
| Company: | TradeSystemGuru.com |
| Address: | Box 2589 |
| Garibaldi Highlands, BC Canada | |
| Phone # for sales: | 604-898-9069 |
| Fax: | 604-898-9069 |
| Website: | www.tradesystemguru.com |
| E-mail address: | indextradermb@gmail.com |
Traders' Resource Links | |
| TradeSystemGuru.com has not added any product or service information to TRADERS' RESOURCE. | |
Click here for more information about our publications!
Comments
Date: 05/03/12Rank: 4Comment:

Request Information From Our Sponsors
- VectorVest, Inc.
- Executive Premier Workshop
- One-Day Options Course
- OptionsPro
- Retirement Income Workshop
- Sure-Fire Trading Systems (VectorVest, Inc.)
- Trading as a Business Workshop
- VectorVest 7 EOD
- VectorVest 7 RealTime/IntraDay
- VectorVest AutoTester
- VectorVest Educational Services
- VectorVest OnLine
- VectorVest Options Analyzer
- VectorVest ProGraphics v6.0
- VectorVest ProTrader 7
- VectorVest RealTime Derby Tool
- VectorVest Simulator
- VectorVest Variator
- VectorVest Watchdog
- StockCharts.com, Inc.
- Candle Patterns
- Candlestick Charting Explained
- Intermarket Technical Analysis
- John Murphy on Chart Analysis
- John Murphy's Chart Pattern Recognition
- John Murphy's Market Message
- MurphyExplainsMarketAnalysis-Intermarket Analysis
- MurphyExplainsMarketAnalysis-Visual Analysis
- StockCharts.com
- Technical Analysis of the Financial Markets
- The Visual Investor
