HOT TOPICS LIST
- MACD
- Fibonacci
- RSI
- Gann
- ADXR
- Stochastics
- Volume
- Triangles
- Futures
- Cycles
- Volatility
- ZIGZAG
- MESA
- Retracement
- Aroon
INDICATORS LIST
LIST OF TOPICS
PRINT THIS ARTICLE
by Donald W. Pendergast, Jr.
After retracing 80% of the last major rally, shares of Stillwater Mining may finally have made a major multicycle low.
Position: N/A
Donald W. Pendergast, Jr.
Donald W. Pendergast is a financial markets consultant who offers specialized services to stock brokers and high net worth individuals who seek a better bottom line for their portfolios.
PRINT THIS ARTICLE
CYCLES
Finally A Bottom For Stillwater Mining?
05/02/12 08:52:42 AMby Donald W. Pendergast, Jr.
After retracing 80% of the last major rally, shares of Stillwater Mining may finally have made a major multicycle low.
Position: N/A
| One thing is for certain about many mining stocks, and that is they tend to be at least twice as volatile as the Standard & Poor's 500 (.SPX), with the more liquid issues offering regular windows of opportunity for skilled swing traders to capitalize on. One of the more volatile issues in this particular niche of the stock market happens to be Stillwater Mining (SWC), and that will be the focus of our chart examination. See Figure 1. |

|
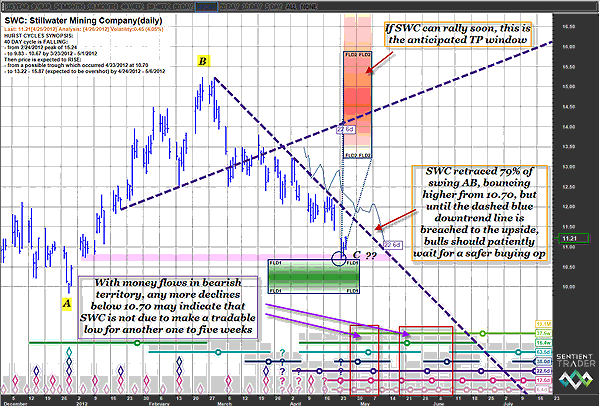
| FIGURE 1: SWC, DAILY. Until the dashed blue VTL closest to the current price of this stock is breached to the upside on a daily close, the dominant trend in SWC will still be considered bearish. |
| Graphic provided by: Sentient Trader. |
| |
| SWC enjoyed a very strong rally from late December 2011 until late February 2012, surging from 9.83 to 15.24 during that period (the swing higher extends from point A to B on the chart). However, instead of simply putting a buy-the-dip kind of pullback after that phase of the rally, the stock proceeded to sell off steadily over the next two months, erasing about 80% of the gains accrued during swing AB's ascension. While Fibonacci traders will recognize that the 79% retracement is fairly meaningful, in the overall context of SWC's severe downtrend, we need to look at two other vital technical concepts before assuring ourselves that SWC has indeed bottomed and is (perhaps) ready to begin a relief rally. The first thing we want to know is this: Has the 40-day cycle low for this stock been officially confirmed by a rise in price back above the blue-dashed downtrend line (also known as a "valid trendline," or VTL)? Second, what is the current state of the money flow in the stock? Is it beginning to show signs that the stock is under accumulation by the smart money? Is it manifesting signs of bullish price/money flow divergence? |

|
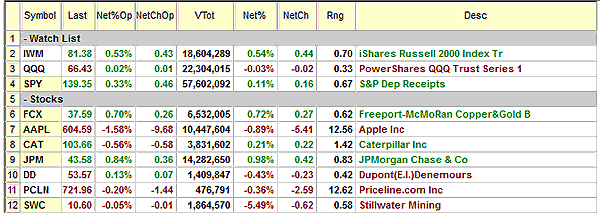
| FIGURE 2: SWC DATA. During the trading session immediately following the analysis of the daily chart of SWC, the stock fell by more than 5% at one point during the day, suggesting that there may be even more downside to come in the days ahead. |
| Graphic provided by: TradeStation. |
| |
| The answer to the first question, is "No" -- the stock remains well below its VTL, and until it makes a daily close above that line, we have no evidence that the stock has bottomed out on its all-important (for swing traders using a daily chart, that is) 40-day trading cycle. And as for SWC's money flow situation, there is good news and bad news; there is some minor bullish divergence with price, but the absolute posture of the money flow (based on the 34-period Chaikin money flow (CMF)(34) histogram)) is still mired deep in bearish territory. The green shaded box on the chart depicts the time/price (TP) zone in which SWC needs to bottom within in order for it to have a chance of reaching the red TP zone by May 6, 2012, but SWC has only three more trading sessions in which to make that turn higher; otherwise, this particular cycle projection will need to be revised. If you look toward the right, near the bottom of the chart, the two red outlined areas depict where the next major multicycle low in SWC may very well be made, particularly if 10.70 is taken out to the downside soon. The broad US markets are in a wait-and-see mode right now, but within the next couple of weeks, the current phase of sideways action should resolve with a sharp, swift move up -- or down. SWC might also benefit from such a move, so wait and see if this stock can make a daily close above the VTL, preferably after the next sharp selloff in the .SPX, before establishing a new position in this market. See Figure 2. |
Donald W. Pendergast is a financial markets consultant who offers specialized services to stock brokers and high net worth individuals who seek a better bottom line for their portfolios.
| Title: | Writer, market consultant |
| Company: | Linear Trading Systems LLC |
| Jacksonville, FL 32217 | |
| Phone # for sales: | 904-239-9564 |
| E-mail address: | lineartradingsys@gmail.com |
Traders' Resource Links | |
| Linear Trading Systems LLC has not added any product or service information to TRADERS' RESOURCE. | |
Click here for more information about our publications!
PRINT THIS ARTICLE

Request Information From Our Sponsors
- VectorVest, Inc.
- Executive Premier Workshop
- One-Day Options Course
- OptionsPro
- Retirement Income Workshop
- Sure-Fire Trading Systems (VectorVest, Inc.)
- Trading as a Business Workshop
- VectorVest 7 EOD
- VectorVest 7 RealTime/IntraDay
- VectorVest AutoTester
- VectorVest Educational Services
- VectorVest OnLine
- VectorVest Options Analyzer
- VectorVest ProGraphics v6.0
- VectorVest ProTrader 7
- VectorVest RealTime Derby Tool
- VectorVest Simulator
- VectorVest Variator
- VectorVest Watchdog
- StockCharts.com, Inc.
- Candle Patterns
- Candlestick Charting Explained
- Intermarket Technical Analysis
- John Murphy on Chart Analysis
- John Murphy's Chart Pattern Recognition
- John Murphy's Market Message
- MurphyExplainsMarketAnalysis-Intermarket Analysis
- MurphyExplainsMarketAnalysis-Visual Analysis
- StockCharts.com
- Technical Analysis of the Financial Markets
- The Visual Investor
