HOT TOPICS LIST
- MACD
- Fibonacci
- RSI
- Gann
- ADXR
- Stochastics
- Volume
- Triangles
- Futures
- Cycles
- Volatility
- ZIGZAG
- MESA
- Retracement
- Aroon
INDICATORS LIST
LIST OF TOPICS
PRINT THIS ARTICLE
by Donald W. Pendergast, Jr.
It's a bit sloppy and definitely not a textbook-quality example, but a bearish head & shoulders pattern has been slowly grinding toward completion on IWM's daily chart.
Position: N/A
Donald W. Pendergast, Jr.
Donald W. Pendergast is a financial markets consultant who offers specialized services to stock brokers and high net worth individuals who seek a better bottom line for their portfolios.
PRINT THIS ARTICLE
HEAD & SHOULDERS
With IWM, A Big Head And Shoulders Pattern
04/27/12 10:27:47 AMby Donald W. Pendergast, Jr.
It's a bit sloppy and definitely not a textbook-quality example, but a bearish head & shoulders pattern has been slowly grinding toward completion on IWM's daily chart.
Position: N/A
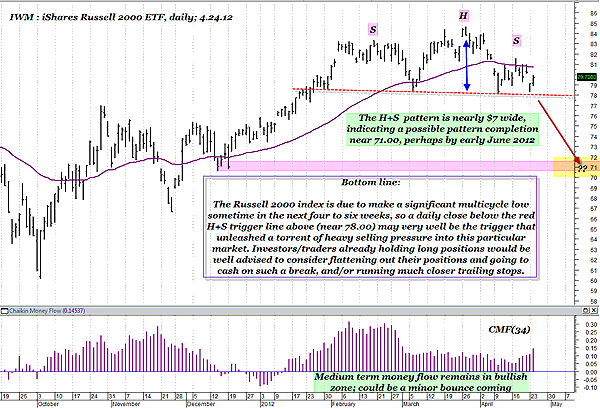
| Chart pattern analysis can be very helpful for traders and investors seeking an edge in the markets, but they seem to be most useful when combined with other forms of technical analysis, including technical indicators, multi-time frame analysis, and trading system signals. Currently, an interesting but slightly ugly head & shoulders pattern has come very close to a possible completion with a decisive move higher or lower likely to be seen in the next week or so. Here's a closer look (see Figure 1). |

|
| FIGURE 1: IWM, DAILY. Trading chart pattern breakouts is more art than science, but with a significant multicycle low due in IWM within the next six weeks, the weak right shoulder bounce could be giving early notice of a major thrust lower in this market. |
| Graphic provided by: MetaStock. |
| |
| The visual imagery presented is fairly compelling and direct; any decisive break below the 78.00 level in the iShares Russell 2000 exchange traded fund (ETF) (IWM) would appear to complete the head & shoulders pattern that has been taking form over the past several months. One of the more intriguing aspects of this particular pattern is how weak the right shoulder is (assuming it is a completed shoulder portion of the pattern, of course). With a major, multicycle low in IWM anticipated to occur in late May-early June 2012, it may just be that IWM's weak bounce as the right shoulder formed was an early indication of this key small-cap ETF to begin its anticipated trip down toward lower valuation levels, and soon (Figure 2). The H&S pattern is nearly 7.00 points wide (measured from the top of the head to the lower red support line), offering traders and investors a rational idea of where a logical price target might be found for a potential breakdown of the pattern. The 71.00 area might be the goal in this case, noting especially the decent amount of chart support found in that area -- the mid-December 2012 swing lows near $70.50 also coinciding with the target price for an H&S breakdown. Now, of course, these are all idealized projections, and the actual manner in which this anticipated (but not guaranteed to happen, by any means) H&S breakdown unfolds is really anyone's guess. |

|
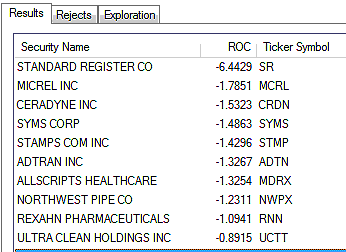
| FIGURE 2: SMALL-CAPS. Ten small caps that are underperforming the Russell 2000 index over the past calendar quarter. Here, all have just fired RMO (Rahul Mohindar) trading system sell signals. |
| Graphic provided by: MetaStock. |
| Graphic provided by: MetaStock Explorer. |
| |
| Playing such a breakdown might involve something as simple as buying at or slightly in the money put options with perhaps three months' time value and a profit target of a 100% increase in the value of the puts. The red dashed support line could act as your initial stop for such a trade, too; any daily close of IWM back above that line after a subsequent break would cause you to sell the put, no questions asked. Stock traders might view a breakdown out of the H&S in IWM as an opportunity to scan for the weakest relative strength small-cap stocks that are also issuing mechanical sell signals from reliable trading systems. There are a nearly infinite number of ways to trade such a potential pattern breakdown in such a key index that skilled traders should have little or no trouble in positioning themselves for a shot at the short side of the small-cap market again. Regardless of the type of trade, always limit the risk to your account to no more than 1% or 2%, maximum. |
Donald W. Pendergast is a financial markets consultant who offers specialized services to stock brokers and high net worth individuals who seek a better bottom line for their portfolios.
| Title: | Writer, market consultant |
| Company: | Linear Trading Systems LLC |
| Jacksonville, FL 32217 | |
| Phone # for sales: | 904-239-9564 |
| E-mail address: | lineartradingsys@gmail.com |
Traders' Resource Links | |
| Linear Trading Systems LLC has not added any product or service information to TRADERS' RESOURCE. | |
Click here for more information about our publications!
Comments
Date: 05/04/12Rank: 3Comment:

Request Information From Our Sponsors
- StockCharts.com, Inc.
- Candle Patterns
- Candlestick Charting Explained
- Intermarket Technical Analysis
- John Murphy on Chart Analysis
- John Murphy's Chart Pattern Recognition
- John Murphy's Market Message
- MurphyExplainsMarketAnalysis-Intermarket Analysis
- MurphyExplainsMarketAnalysis-Visual Analysis
- StockCharts.com
- Technical Analysis of the Financial Markets
- The Visual Investor
- VectorVest, Inc.
- Executive Premier Workshop
- One-Day Options Course
- OptionsPro
- Retirement Income Workshop
- Sure-Fire Trading Systems (VectorVest, Inc.)
- Trading as a Business Workshop
- VectorVest 7 EOD
- VectorVest 7 RealTime/IntraDay
- VectorVest AutoTester
- VectorVest Educational Services
- VectorVest OnLine
- VectorVest Options Analyzer
- VectorVest ProGraphics v6.0
- VectorVest ProTrader 7
- VectorVest RealTime Derby Tool
- VectorVest Simulator
- VectorVest Variator
- VectorVest Watchdog
