HOT TOPICS LIST
- MACD
- Fibonacci
- RSI
- Gann
- ADXR
- Stochastics
- Volume
- Triangles
- Futures
- Cycles
- Volatility
- ZIGZAG
- MESA
- Retracement
- Aroon
INDICATORS LIST
LIST OF TOPICS
PRINT THIS ARTICLE
by Chaitali Mohile
The pullback rally of Time Warner faces strong hurdles on its bullish path.
Position: N/A
Chaitali Mohile
Active trader in the Indian stock markets since 2003 and a full-time writer. Trading is largely based upon technical analysis.
PRINT THIS ARTICLE
SUPPORT & RESISTANCE
TWX Stuck At Resistance
05/01/12 01:26:38 PMby Chaitali Mohile
The pullback rally of Time Warner faces strong hurdles on its bullish path.
Position: N/A
| Time Warner (TWX) began a relief rally in early 2009. Initially, the rally was healthily bullish. We can see many long white candles with upper shadows in Figure 1. Although the upper shadows occur when the stock closes below the intraday high, indicating bears involvement in the rally, the candles in Figure 1 are opening either near the previous close or high, suggesting bullish sentiment in the rally. The stock formed a new high at the 50-day moving average (MA), which was a strong resistance level. You can see in the chart in Figure 1 that TWX turned sideways as it hit this moving average resistance. The bears waiting on the sidelines tried to grab the show but did not succeed. |

|
| FIGURE 1: TWX, MONTHLY |
| Graphic provided by: StockCharts.com. |
| |
| Prices broke above the 50-day MA, which now acted as a support level to the bullish move. Meanwhile, the 200-day moving average formed a robust resistance for the pullback rally. The second higher high formed by the stock was restricted by the long-term moving average resistance. Thereafter, TWX retraced toward the 50-day MA support, forming a higher low. The three black arrows in Figure 1 highlight the higher lows, and the dotted trendline shows the higher highs of TWX. The pullback rally would remain under bearish pressure till the trendline and the 200-day MA resistance is breached. |
| The relative strength index (RSI) (14) in Figure 1 is also forming a series of higher tops and bottoms. The oscillator never moved above 70 levels, and so, TWX is likely to surge slowly. The moving average convergence/divergence (MACD) (12,26,9) appears to have exhausted its upward move even though it is in positive territory. In addition, the average directional index (ADX (14) is indicating the possibility of a consolidation under the resistance of a trendline and the 200-day MA. These mixed signals are likely to induce high volatility in the stock. |

|
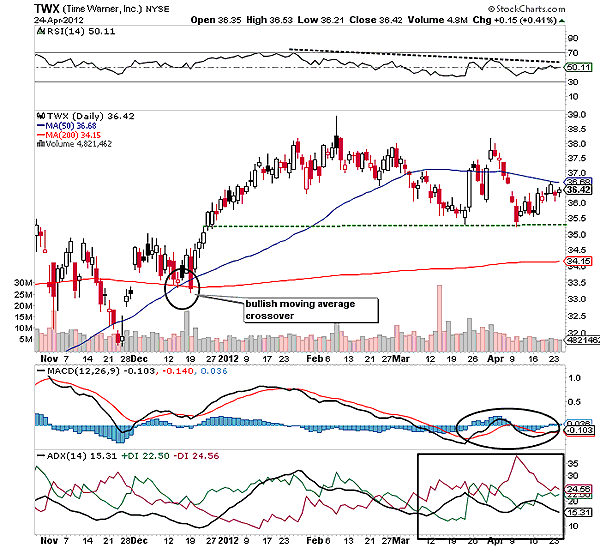
| FIGURE 2: TWX, DAILY |
| Graphic provided by: StockCharts.com. |
| |
| An ascending rally with the support of the 200-day MA and a bullish moving average crossover point in Figure 2 formed a rounded top -- a bearish reversal pattern. Usually, the breakout of a round top is confirmed once the 50-day MA support is breached. However, TWX plunged below the 50-day MA during the pattern formation and hence cannot be considered to be a breakout of the round-top pattern. After establishing support at 35.4 levels, the stock faced resistance at the 50-day MA. |
| The relative strength index (RSI) (14) formed lower highs, signifying diminishing bullish force. The MACD (12,26,9) is shaky below the zero line in negative territory, suggesting weak momentum for TWX. The buying pressure (green line) and selling pressure (red) of the ADX (14) are frequently changing their directions, misguiding the trend indicator. TWX lacks trend support, bullish strength as well as positive momentum, and hence, the stock is likely to remain under the 50-day MA resistance. To conclude, TWX faces major resistance on the monthly and daily charts, which will be difficult to breach. The current situation of TWX is not reflecting any breakout possibility, so it would continue to move under the various resistance levels. |
Active trader in the Indian stock markets since 2003 and a full-time writer. Trading is largely based upon technical analysis.
| Company: | Independent |
| Address: | C1/3 Parth Indraprasth Towers. Vastrapur |
| Ahmedabad, Guj 380015 | |
| E-mail address: | chaitalimohile@yahoo.co.in |
Traders' Resource Links | |
| Independent has not added any product or service information to TRADERS' RESOURCE. | |
Click here for more information about our publications!
Comments

Request Information From Our Sponsors
- StockCharts.com, Inc.
- Candle Patterns
- Candlestick Charting Explained
- Intermarket Technical Analysis
- John Murphy on Chart Analysis
- John Murphy's Chart Pattern Recognition
- John Murphy's Market Message
- MurphyExplainsMarketAnalysis-Intermarket Analysis
- MurphyExplainsMarketAnalysis-Visual Analysis
- StockCharts.com
- Technical Analysis of the Financial Markets
- The Visual Investor
- VectorVest, Inc.
- Executive Premier Workshop
- One-Day Options Course
- OptionsPro
- Retirement Income Workshop
- Sure-Fire Trading Systems (VectorVest, Inc.)
- Trading as a Business Workshop
- VectorVest 7 EOD
- VectorVest 7 RealTime/IntraDay
- VectorVest AutoTester
- VectorVest Educational Services
- VectorVest OnLine
- VectorVest Options Analyzer
- VectorVest ProGraphics v6.0
- VectorVest ProTrader 7
- VectorVest RealTime Derby Tool
- VectorVest Simulator
- VectorVest Variator
- VectorVest Watchdog
