HOT TOPICS LIST
- MACD
- Fibonacci
- RSI
- Gann
- ADXR
- Stochastics
- Volume
- Triangles
- Futures
- Cycles
- Volatility
- ZIGZAG
- MESA
- Retracement
- Aroon
INDICATORS LIST
LIST OF TOPICS
PRINT THIS ARTICLE
by Billy Williams
Price action never presents itself in the plain-vanilla step-by-step format like traders are taught, which is why you need to use tools that are outside the box.
Position: Buy
Billy Williams
Billy Williams has been trading the markets for 27 years, specializing in momentum trading with stocks and options.
PRINT THIS ARTICLE
TECHNICAL ANALYSIS
How To Trade With Inverse Trendlines
04/27/12 10:14:19 AMby Billy Williams
Price action never presents itself in the plain-vanilla step-by-step format like traders are taught, which is why you need to use tools that are outside the box.
Position: Buy
| Strong technical skills are essential to good trading like chart pattern recognition, risk control, effective entries, and a host of other critical tools that a trader has to possess, but it's important to be able to use those skills outside the box when confronted with an erratic market. Mike Tyson once remarked that "everybody's got a plan until they get hit," and for a trader, no finer words could be spoken when confronted with a market whose price action isn't laid out in a predictable fashion. For many traders, you're given the standard presentation of "If X happens, then do Y" in a controlled environment, but trading isn't so nice and tidy. Instead, you will go through a steady series of head-fakes, starts-and-stops price movement and often act so erratically that it will leave you dazed and confused as to what in the world is going on. |

|
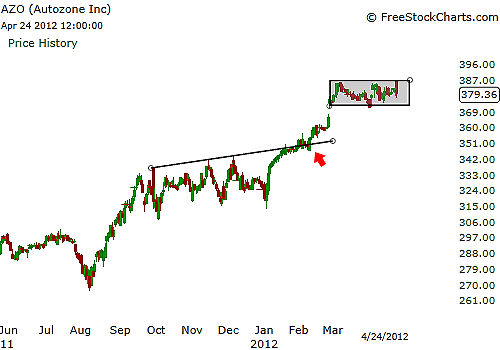
| FIGURE 1: AZO. AZO is a strong-performing stock whose price action began to trade in a contracted price range and didn't offer the opportunity for a typical bullish trendling during this phase. An inverse trendline revealed that the bulls had indeed taken control of price as well as a strong potential entry point. |
| Graphic provided by: www.freestockcharts.com. |
| |
| In order to fully grasp what is going in the market, it helps to have a set of tools that let you trade outside the black & white version of ordinary trade scenarios and instead be able to survive in a schizophrenic stock market. One of those technical tools is the inverse trendline. This is one of those "Bizarro"-world technical analysis tools where up is down and down is up, where you leave the standard world of trading and use this tool to do the opposite of what 90% of the trading world does. |

|
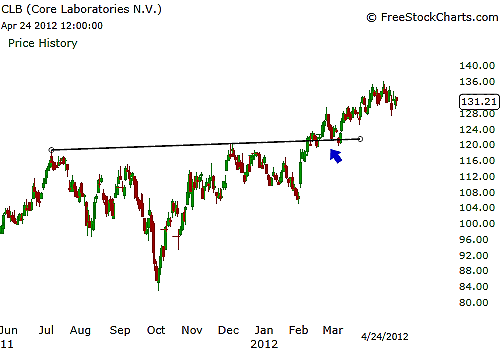
| FIGURE 2: CLB. CLB had a series of start-and-stop trading where price even plunged lower before trading back up through its decline but such moves are confusing to most traders, leading them to doubt what to do next. An ordinary trendline would have revealed a bullish trend, but no inflection point where a long entry would have made itself apparent. In using an inverse trendline, you can see where the bulls have taken control and force price higher as well as a potential buy zone where prices broke through the inverse trendline. |
| Graphic provided by: www.freestockcharts.com. |
| |
| When price begins to base or snap back after a strong thrust in a given direction, the after-effects can create fear and uncertainty in the stock market, and you had better believe that the one thing the stock market hates is uncertainty. In fact, the major players understand this and like to play this game of boosting a stock, only to force it back down to get the hangers-on off the coattails of a promising stock. Even after the stock recovers, many would-be buyers are sufficiently traumatized that they can't quite pull the trigger again and if they can even muster up the nerve to go long again, they end up settling for bite-sized morsels of the stock for fear of getting punted down the field like a frayed leather-back football. |
| So, for example, when the market is in a primary bullish trend but you can't connect the lowest price low with the highest price low, you can use an inverse trendline to trade the upper portion of the contracted price range where you look for the previous lowest price high and connect it to the previous highest price high. This inverse trendline acts as a signal that the bulls are making their move and makes excellent buy points in a stock that has proven its bullish price movement by trading through the trendline, confirming the bull run and a potential entry point. See Figures 1 and 2. |
Billy Williams has been trading the markets for 27 years, specializing in momentum trading with stocks and options.
| Company: | StockOptionSystem.com |
| E-mail address: | stockoptionsystem.com@gmail.com |
Traders' Resource Links | |
| StockOptionSystem.com has not added any product or service information to TRADERS' RESOURCE. | |
Click here for more information about our publications!
Comments

|

Request Information From Our Sponsors
- StockCharts.com, Inc.
- Candle Patterns
- Candlestick Charting Explained
- Intermarket Technical Analysis
- John Murphy on Chart Analysis
- John Murphy's Chart Pattern Recognition
- John Murphy's Market Message
- MurphyExplainsMarketAnalysis-Intermarket Analysis
- MurphyExplainsMarketAnalysis-Visual Analysis
- StockCharts.com
- Technical Analysis of the Financial Markets
- The Visual Investor
- VectorVest, Inc.
- Executive Premier Workshop
- One-Day Options Course
- OptionsPro
- Retirement Income Workshop
- Sure-Fire Trading Systems (VectorVest, Inc.)
- Trading as a Business Workshop
- VectorVest 7 EOD
- VectorVest 7 RealTime/IntraDay
- VectorVest AutoTester
- VectorVest Educational Services
- VectorVest OnLine
- VectorVest Options Analyzer
- VectorVest ProGraphics v6.0
- VectorVest ProTrader 7
- VectorVest RealTime Derby Tool
- VectorVest Simulator
- VectorVest Variator
- VectorVest Watchdog
