HOT TOPICS LIST
- MACD
- Fibonacci
- RSI
- Gann
- ADXR
- Stochastics
- Volume
- Triangles
- Futures
- Cycles
- Volatility
- ZIGZAG
- MESA
- Retracement
- Aroon
INDICATORS LIST
LIST OF TOPICS
PRINT THIS ARTICLE
by Koos van der Merwe
Bank stocks have simply not been performing, but there are the exceptions.
Position: Accumulate
Koos van der Merwe
Has been a technical analyst since 1969, and has worked as a futures and options trader with First Financial Futures in Johannesburg, South Africa.
PRINT THIS ARTICLE
MA ENVELOPES
A New 52-Week High For BBT
04/26/12 09:39:36 AMby Koos van der Merwe
Bank stocks have simply not been performing, but there are the exceptions.
Position: Accumulate
| BB&T Corp. (BBT) is an American bank with assets of US$157 billion (as of March 2011). The bank offers commercial and retail banking services along with other financial services such as insurance, investments, retail brokerage, mortgage, corporate finance, consumer finance, payment services, international banking, leasing, and trust. Unlike the better-known banking names like Bank of America and Citigroup, the share price is making new highs. Is it worth adding to your portfolio at its present price? |

|
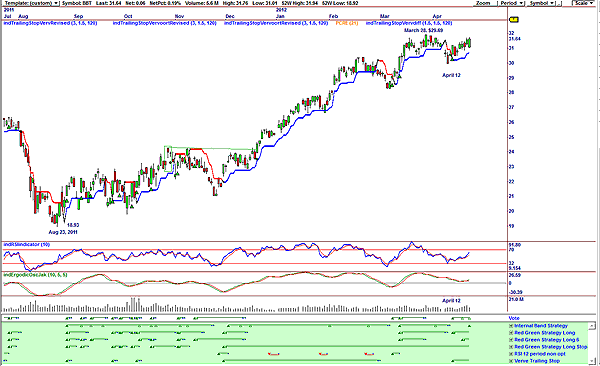
| FIGURE 1: BBT, DAILY. This chart shows vote line buy signals. |
| Graphic provided by: OmniTrader. |
| |
| Figure 1 shows the following: a. A rise in price from a low of $18.93 in August 23, 2011, to a high of $29.69 by March 28, 2012. b. A buy signal given by the vote line on April 12 based on buy signals given by the Verve trailing stop and red-green long strategies. c. The relative strength index (RSI) moving up, suggesting further strength ahead. d. The ergodic oscillator giving a buy signal. e. Rising volume as the price strengthened, suggesting strength. Volume did, however, fall on the last day of trading as the price formed a strong white candlestick body with no lower shadow. This type of candlestick pattern may indicate an up reversal with confirmation the next day. |

|
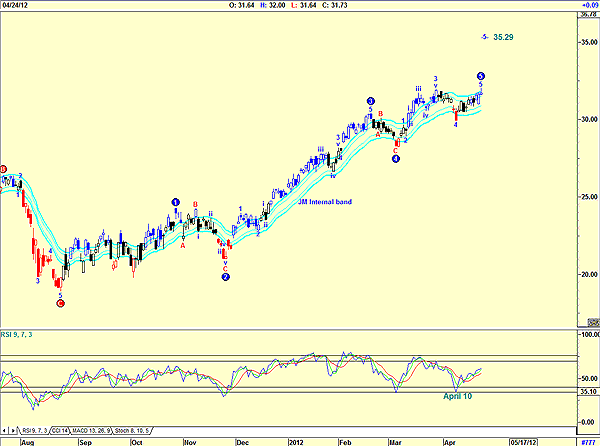
| FIGURE 2: BBT WITH ELLIOTT WAVE ANALYSIS |
| Graphic provided by: AdvancedGET. |
| |
| Figure 2 shows the Elliott wave count, suggesting that an early wave 5 has been completed, with a possible alternate wave 5 target of $32.29 should the price move strongly higher. The JM internal band is suggesting a possible buy signal, as the price looks as though it broke above the upper band with trading on April 24, a price not shown on Figure 1. Note also that the XTL trend indicator has the candlestick as blue, suggesting strength. Finally, note that the RSI appears to be moving sideways after having formed a V-bottom on April 10, not a customary RSI 14-period buy signal, but a buy signal based on a nine-period RSI. I would be a buyer of BBT Corp. on any and every correction as long as the price does not fall below the lower band of the JM internal band. Should this happen, a review of the technical data would be necessary. |
Has been a technical analyst since 1969, and has worked as a futures and options trader with First Financial Futures in Johannesburg, South Africa.
| Address: | 3256 West 24th Ave |
| Vancouver, BC | |
| Phone # for sales: | 6042634214 |
| E-mail address: | petroosp@gmail.com |
Click here for more information about our publications!
PRINT THIS ARTICLE

|

Request Information From Our Sponsors
- StockCharts.com, Inc.
- Candle Patterns
- Candlestick Charting Explained
- Intermarket Technical Analysis
- John Murphy on Chart Analysis
- John Murphy's Chart Pattern Recognition
- John Murphy's Market Message
- MurphyExplainsMarketAnalysis-Intermarket Analysis
- MurphyExplainsMarketAnalysis-Visual Analysis
- StockCharts.com
- Technical Analysis of the Financial Markets
- The Visual Investor
- VectorVest, Inc.
- Executive Premier Workshop
- One-Day Options Course
- OptionsPro
- Retirement Income Workshop
- Sure-Fire Trading Systems (VectorVest, Inc.)
- Trading as a Business Workshop
- VectorVest 7 EOD
- VectorVest 7 RealTime/IntraDay
- VectorVest AutoTester
- VectorVest Educational Services
- VectorVest OnLine
- VectorVest Options Analyzer
- VectorVest ProGraphics v6.0
- VectorVest ProTrader 7
- VectorVest RealTime Derby Tool
- VectorVest Simulator
- VectorVest Variator
- VectorVest Watchdog
