

HOT TOPICS LIST
- MACD
- Fibonacci
- RSI
- Gann
- ADXR
- Stochastics
- Volume
- Triangles
- Futures
- Cycles
- Volatility
- ZIGZAG
- MESA
- Retracement
- Aroon
INDICATORS LIST
LIST OF TOPICS
PRINT THIS ARTICLE
by Mike Carr, CMT
Cycles point to a correction and then strong gains in stock prices through the end of the year.
Position: Sell
Mike Carr, CMT
Mike Carr, CMT, is a member of the Market Technicians Association, and editor of the MTA's newsletter, Technically Speaking. He is also the author of "Smarter Investing in Any Economy: The Definitive Guide to Relative Strength Investing," and "Conquering the Divide: How to Use Economic Indicators to Catch Stock Market Trends."
PRINT THIS ARTICLE
CYCLES
Long-Term Cycles Offer Short-Term Warnings For Stocks
04/26/12 09:22:16 AMby Mike Carr, CMT
Cycles point to a correction and then strong gains in stock prices through the end of the year.
Position: Sell
| Over the years, traders have identified a number of cycles in the stock market. Some focus on very short-term cycles but there are a number of factors that can influence short-term price changes, and these shorter cycles tend to have limited effectiveness. Longer-term cycles lasting decades have been identified, however; they also have provided limited effectiveness. The popular Kondratieff cycle averages 54 years in duration, and some believe that it projects market turning points. This was identified in the 1920s and 1930s, but it hasn't worked as precisely since then as it did in the past. |
| The decennial cycle seeks to identify patterns based on where we are within the decade. When used only to identify the tendency of the market, the decennial pattern can be very useful. Years ending in "5" and "8" have historically been the best-performing years, with strong gains on average and closing higher about 80% of the time. Although the pattern suggested bullishness was appropriate, this broke down terribly in 2008, which was the worst year in the market since 1937. In 2005, the market also defied expectations based on the decennial cycle and fell slightly. Years ending in "2," like 2012, have been up about 60% of the time and the average gain has been about 5%. |
| The Dow Jones Industrial Average (DJIA) is shown with the decennial cycle overlaid in Figure 1. This is a monthly chart and shows that a significant low is projected in September. While the cycle does not precisely fit the data, the low in 2002 was timed nearly perfectly. Using only this cycle to take a position in the market would not be wise, but it could be helpful to know that it is bearish going into the autumn. |
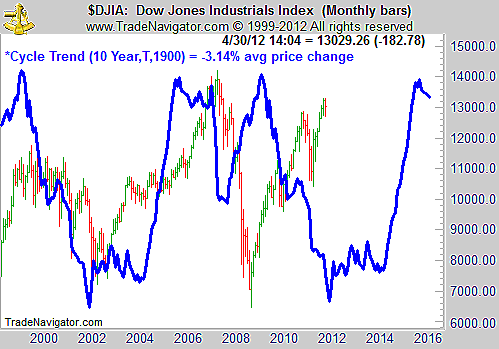
|
| FIGURE 1: DJIA, MONTHLY. The decennial pattern forecasts strong gains beginning in 2014, but choppy markets until then. |
| Graphic provided by: Trade Navigator. |
| |
| A shorter cycle is the four-year, Presidential cycle, which is based on the US election cycle. Logically, it makes sense that politics would have an impact on markets and it is also logical that fiscal policy could be affected by election-year politics. This cycle is more bullish but still predicts a decline into the end of May and a long basing process after that into the autumn. See Figure 2. |
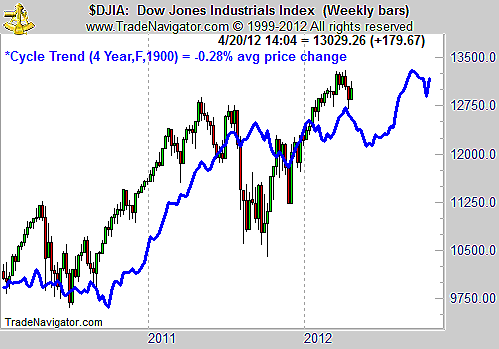
|
| FIGURE 2: DJIA, WEEKLY |
| Graphic provided by: Trade Navigator. |
| |
| Cycles seem to add a degree of scientific certainty to market timing, but they can and do fail to work. It is best to consider cycles as one input into a market trading strategy. These long-term cycles are bearish on stocks and indicate that recent weakness could be pointing toward short-term weakness ahead. This is likely to be just a correction in the new bull market that started with the October 2011 lows. However, traders could consider becoming defensive through the summer months. Stocks have been volatile in the summers preceding the 2008 and 2010 elections. Last year's summer decline qualified as a bear market in both depth and duration. Given the large gains in the first months of 2012, a correction would be expected, and cycles point to that correction in the weeks ahead. |
Mike Carr, CMT, is a member of the Market Technicians Association, and editor of the MTA's newsletter, Technically Speaking. He is also the author of "Smarter Investing in Any Economy: The Definitive Guide to Relative Strength Investing," and "Conquering the Divide: How to Use Economic Indicators to Catch Stock Market Trends."
| Website: | www.moneynews.com/blogs/MichaelCarr/id-73 |
| E-mail address: | marketstrategist@gmail.com |
Click here for more information about our publications!
PRINT THIS ARTICLE

Request Information From Our Sponsors
- StockCharts.com, Inc.
- Candle Patterns
- Candlestick Charting Explained
- Intermarket Technical Analysis
- John Murphy on Chart Analysis
- John Murphy's Chart Pattern Recognition
- John Murphy's Market Message
- MurphyExplainsMarketAnalysis-Intermarket Analysis
- MurphyExplainsMarketAnalysis-Visual Analysis
- StockCharts.com
- Technical Analysis of the Financial Markets
- The Visual Investor
- VectorVest, Inc.
- Executive Premier Workshop
- One-Day Options Course
- OptionsPro
- Retirement Income Workshop
- Sure-Fire Trading Systems (VectorVest, Inc.)
- Trading as a Business Workshop
- VectorVest 7 EOD
- VectorVest 7 RealTime/IntraDay
- VectorVest AutoTester
- VectorVest Educational Services
- VectorVest OnLine
- VectorVest Options Analyzer
- VectorVest ProGraphics v6.0
- VectorVest ProTrader 7
- VectorVest RealTime Derby Tool
- VectorVest Simulator
- VectorVest Variator
- VectorVest Watchdog