HOT TOPICS LIST
- MACD
- Fibonacci
- RSI
- Gann
- ADXR
- Stochastics
- Volume
- Triangles
- Futures
- Cycles
- Volatility
- ZIGZAG
- MESA
- Retracement
- Aroon
INDICATORS LIST
LIST OF TOPICS
PRINT THIS ARTICLE
by Billy Williams
Is the SPX faltering and weakness setting in? If it is, now may be the time to identify strength to spot tomorrow's new stock leaders.
Position: Hold
Billy Williams
Billy Williams has been trading the markets for 27 years, specializing in momentum trading with stocks and options.
PRINT THIS ARTICLE
REL. STR COMPARATIVE
Buying Strength In A Time Of Weakness
04/26/12 10:06:54 AMby Billy Williams
Is the SPX faltering and weakness setting in? If it is, now may be the time to identify strength to spot tomorrow's new stock leaders.
Position: Hold
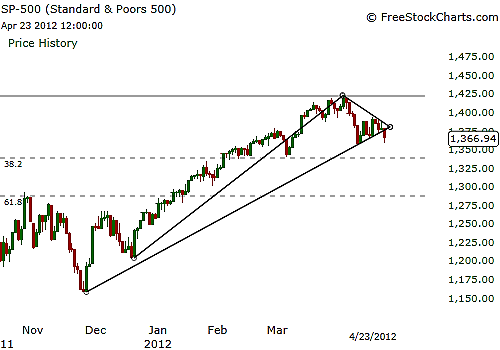
| The Standard & Poor's 500 (SPX) has been on an incredible run since its bottom in November 2011, where fears of a European debt default and high unemployment in the US had many traders wondering if in this year-end holiday there would be any hope left among the investment community or whether 2012 would find itself at Ground Zero of an epic bear market. See Figure 1. But rising out of the ashes, the stock market rebounded and against the odds managed to claw its way back as the bulls began to buy at the bottom and later piled on to push the SPX higher. Now, the SPX is looking like it is in trouble and faltering with price weakness setting in. Will the bulls hand back control of the market to the bears again? Every beginning trader knows that markets go up and down, but when markets start to pull back after a big run without so much as stopping to catch its breath, it becomes a little more real for the trader who "knows" these things and the trader who understands the gift of price reversal and how to profit from it. |

|
| FIGURE 1: SPX. The SPX rebounded from its November 2011 lows to its current price level and is still in a bullish trend. Though price has pulled back, it is well within the 0.382 Fibonacci retracement level, indicating there is a good chance that it will go higher from this level. But weakness in price can be seen as the SPX trades along a major bullish trendline with the potential of a price reversal. |
| Graphic provided by: www.freestockcharts.com. |
| |
| First, answer this question: Would you prefer to buy stocks at the bottom or would you like to buy the strongest stocks in the market? What do you think would yield the highest profits over the long run? If you answered buying stocks at the bottom, then you would not only be wrong, but your results would be mediocre at best. Why? Because stocks that have crashed to all-time lows rarely recover and often drift along the bottom of the stock market's ocean bed, never to surface for air again. If you picked buying the strongest stocks, then congratulations, you've avoided being tucked away in the limbo of Davy Jones's locker and have not only been correct, but any stocks that you've bought with the highest relative strength in either a bearish or bullish market has far exceeded the market's average return. This simple distinction has placed you in the upper echelon of traders who consistently make money and avoid catastrophic drawdowns in trading capital. |

|
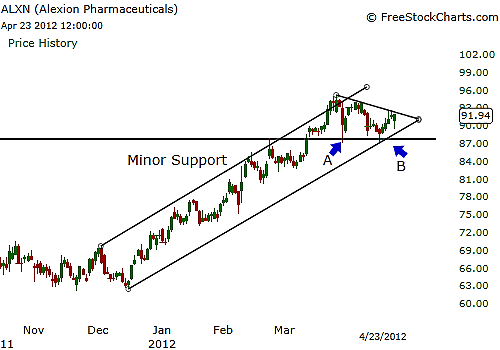
| FIGURE 2: ALXN. ALXN has been a major force in the stock market as one of the market's preeminent stock leaders. ALXN has been trading at the upper range of its price channel until price weakness spilled over from the major indexes. The stock has found minor support at points A and B but still has to break through the upper bearish trendline before making another run to the upside. More than likely, this move will have to follow the SPX, provided that the index's price resumes its bullish run. Stocks like ALXN should be taken note of in order to catch a move in a stock leader should it resumes its climber higher. |
| Graphic provided by: www.freestockcharts.com. |
| |
| Relative strength (RS) is a simple indicator that ranks a stock from 1 (the weakest range) to 100 (the strongest range), based on the performance on a comparative basis with the general market. Stocks with a high RS tend to be market leaders that will take the overall market to higher price levels and during market declines tend to resist the downward pull of bearish markets by trading at the upper range of their respective price highs. It is during these price declines in which the strongest stocks become more obvious as they resist the pull of the major indexes like the Dow Jones Industrial Average (DJIA) and the SPX and often form base patterns till the next bull run. Now is the time where the SPX is showing signs of price weakness, as it contracts in a tight range after a long overdue pullback. Stocks such as Alexion Pharmaceuticals (ALXN) are not only resisting the larger market's bearish telltale signs but is setting up to trade higher as ALXN's price action trades near its all-time price high. See Figure 2. |
| The general market is still bullish and it's hardly a time to start liquidating everything, but it would be a good idea to stay alert and make adjustments based on the next few days' trading action. More important, it's a good idea to start identifying strength in individual stocks at a time of market weakness to develop a hit list of potential stock leaders that could emerge and take the market higher if it recovers. |
Billy Williams has been trading the markets for 27 years, specializing in momentum trading with stocks and options.
| Company: | StockOptionSystem.com |
| E-mail address: | stockoptionsystem.com@gmail.com |
Traders' Resource Links | |
| StockOptionSystem.com has not added any product or service information to TRADERS' RESOURCE. | |
Click here for more information about our publications!
Comments
Date: 05/03/12Rank: 4Comment: It is hard to assess relative strength comparing 2 price charts. How could you objectively compare several stocks. And what about stocks that do not show any pullback, it could be vulnerable vs a stock that has a small pull back and be ready for the next run.

Request Information From Our Sponsors
- StockCharts.com, Inc.
- Candle Patterns
- Candlestick Charting Explained
- Intermarket Technical Analysis
- John Murphy on Chart Analysis
- John Murphy's Chart Pattern Recognition
- John Murphy's Market Message
- MurphyExplainsMarketAnalysis-Intermarket Analysis
- MurphyExplainsMarketAnalysis-Visual Analysis
- StockCharts.com
- Technical Analysis of the Financial Markets
- The Visual Investor
- VectorVest, Inc.
- Executive Premier Workshop
- One-Day Options Course
- OptionsPro
- Retirement Income Workshop
- Sure-Fire Trading Systems (VectorVest, Inc.)
- Trading as a Business Workshop
- VectorVest 7 EOD
- VectorVest 7 RealTime/IntraDay
- VectorVest AutoTester
- VectorVest Educational Services
- VectorVest OnLine
- VectorVest Options Analyzer
- VectorVest ProGraphics v6.0
- VectorVest ProTrader 7
- VectorVest RealTime Derby Tool
- VectorVest Simulator
- VectorVest Variator
- VectorVest Watchdog
