HOT TOPICS LIST
- MACD
- Fibonacci
- RSI
- Gann
- ADXR
- Stochastics
- Volume
- Triangles
- Futures
- Cycles
- Volatility
- ZIGZAG
- MESA
- Retracement
- Aroon
INDICATORS LIST
LIST OF TOPICS
PRINT THIS ARTICLE
by Donald W. Pendergast, Jr.
Now that shares of Baker Hughes have made their initial thrust lower out of a large pennant pattern, will the continued selling in the broad markets help speed the stock toward the lower $30 range?
Position: N/A
Donald W. Pendergast, Jr.
Donald W. Pendergast is a financial markets consultant who offers specialized services to stock brokers and high net worth individuals who seek a better bottom line for their portfolios.
PRINT THIS ARTICLE
TRADING SYSTEMS
Is Baker Hughes A Continuation Move In Progress?
04/27/12 09:01:34 AMby Donald W. Pendergast, Jr.
Now that shares of Baker Hughes have made their initial thrust lower out of a large pennant pattern, will the continued selling in the broad markets help speed the stock toward the lower $30 range?
Position: N/A
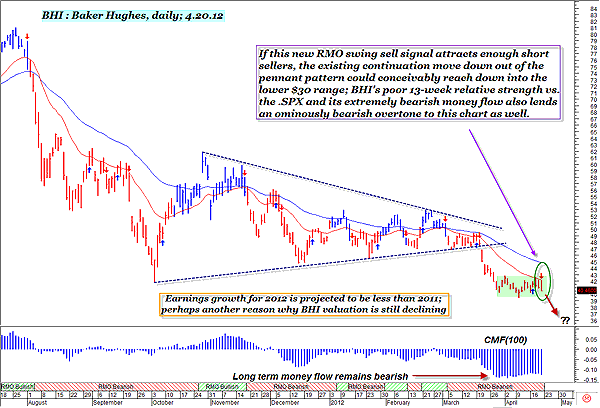
| The recent corrective move in the broad US markets, while not a surprise to most seasoned technicians, did appear to catch many drowsy long-term investors asleep at the wheel as the .SPX and other major indexes all took about a 4% to 5% hit since peaking earlier this month. The grinding, tortuous topping/correction process in the .SPX during March-April 2012 also took quite a toll on the valuation of Baker Hughes (BHI), one of the premier oil services firms in the world. The stock is down more than 15% just since March 21, 2012, since plunging south from the huge daily bar-based pennant pattern. Currently, BHI appears to be in a minor consolidation zone (see green shaded box on Figure 1), which, in the context of the overall large-scale downtrend, may be yet another early warning signal of more continuation moves (to lower prices) yet to come. With the long-term money flow (based on the 100-period Chaikin money flow histogram (CMF)(100)) mired in heavily bearish territory, any new break below BHI's most recent swing low of 39.40 should be looked upon as a fairly low-risk shorting opportunity. The large pennant pattern's ideal price target is in the lower $30 range, and therefore a break down from this minor consolidation could be the trigger to really get the hungry bears going once again in this declining issue. |

|
| FIGURE 1: BHI, DAILY. After falling sharply lower from a large pennant pattern, has BHI finally located a strong area of support near 40.00 or is it destined to sell off on yet another continuation move lower? |
| Graphic provided by: MetaStock. |
| Graphic provided by: RMO indicators from MetaStock 11. |
| |
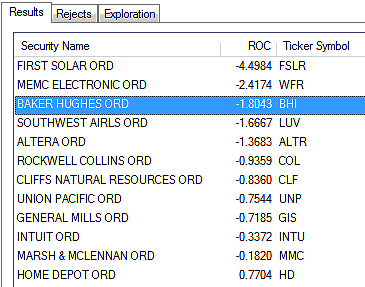
| BHI also has poor 13-week comparative relative strength vs. the .SPX and has just fired a new RMO (Rahul Mohindar) swing sell signal; a drop below 40.45 will theoretically trigger a new short entry. More aggressive traders could use that trigger price to go short, while more conservative traders might want to wait for 39.40 to be taken out instead. The next two support levels appear at 38.69 and 36.76, respectively, and those could be great, logical target prices for near-term put option buyers to aim for on a continued move southward by BHI. Using puts with two to three months of time value that are at or slightly in the money might be one low-risk way to play any upcoming break of support in the stock, as you already have heavy bearish pressure weighing on the stock, with only one real support level left (at 39.40) to hold back a potentially swift plunge toward 38.69-37.76. Just be sure to wait for the breakdown before buying the puts and be prepared to sell the puts if they decline in value by 50% or if your profit target is hit, whichever comes first. See Figure 2. |

|
| FIGURE 2: LARGE-CAP STOCKS. Twelve large-cap stocks firing RMO swing sell signals at the close of trading on April 20, 2012. All but one stock is underperforming the .SPX over that past calendar quarter. |
| Graphic provided by: MetaStock. |
| Graphic provided by: MetaStock Explorer. |
| |
| As a side note, the .SPX isn't anticipated to make a significant multicycle low until the latter half of May or early June 2012, so the law of probabilities would still seem to favor more downside in BHI in the very near future. BHI has a three-year correlation of 0.71 vs. the .SPX, so any meaningful further decline in the .SPX should benefit BHI short sellers, too. |
Donald W. Pendergast is a financial markets consultant who offers specialized services to stock brokers and high net worth individuals who seek a better bottom line for their portfolios.
| Title: | Writer, market consultant |
| Company: | Linear Trading Systems LLC |
| Jacksonville, FL 32217 | |
| Phone # for sales: | 904-239-9564 |
| E-mail address: | lineartradingsys@gmail.com |
Traders' Resource Links | |
| Linear Trading Systems LLC has not added any product or service information to TRADERS' RESOURCE. | |
Click here for more information about our publications!
Comments

Request Information From Our Sponsors
- StockCharts.com, Inc.
- Candle Patterns
- Candlestick Charting Explained
- Intermarket Technical Analysis
- John Murphy on Chart Analysis
- John Murphy's Chart Pattern Recognition
- John Murphy's Market Message
- MurphyExplainsMarketAnalysis-Intermarket Analysis
- MurphyExplainsMarketAnalysis-Visual Analysis
- StockCharts.com
- Technical Analysis of the Financial Markets
- The Visual Investor
- VectorVest, Inc.
- Executive Premier Workshop
- One-Day Options Course
- OptionsPro
- Retirement Income Workshop
- Sure-Fire Trading Systems (VectorVest, Inc.)
- Trading as a Business Workshop
- VectorVest 7 EOD
- VectorVest 7 RealTime/IntraDay
- VectorVest AutoTester
- VectorVest Educational Services
- VectorVest OnLine
- VectorVest Options Analyzer
- VectorVest ProGraphics v6.0
- VectorVest ProTrader 7
- VectorVest RealTime Derby Tool
- VectorVest Simulator
- VectorVest Variator
- VectorVest Watchdog
