

HOT TOPICS LIST
- MACD
- Fibonacci
- RSI
- Gann
- ADXR
- Stochastics
- Volume
- Triangles
- Futures
- Cycles
- Volatility
- ZIGZAG
- MESA
- Retracement
- Aroon
INDICATORS LIST
LIST OF TOPICS
PRINT THIS ARTICLE
by Chaitali Mohile
BWP looks eager to break in an upward direction.
Position: N/A
Chaitali Mohile
Active trader in the Indian stock markets since 2003 and a full-time writer. Trading is largely based upon technical analysis.
PRINT THIS ARTICLE
BREAKOUTS
BWP Waiting For Breakout
04/30/12 11:54:10 AMby Chaitali Mohile
BWP looks eager to break in an upward direction.
Position: N/A
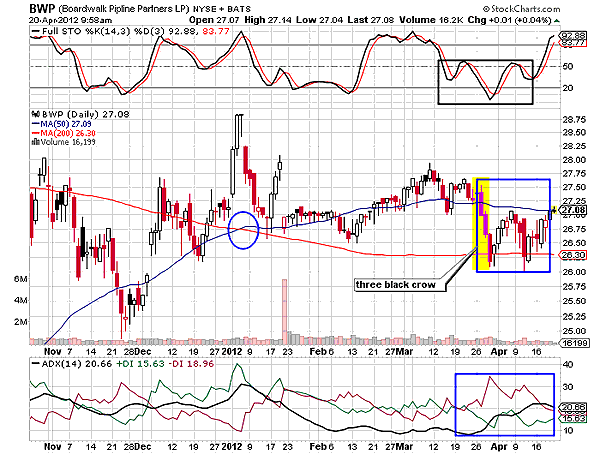
| Boardwalk Pipeline Partners (BWP) is a volatile stock. From the daily chart in Figure 1 you can see that the 50-day and 200-day moving average (MA) support was challenged throughout the rally. The chart is filled with different types of candlestick dojis such as the dragon-fly doji, gravestone doji, long-legged doji, and many more. These candlesticks suggested that there was frequent conflict between buyers and sellers for gaining charge over the rally. Even after a bullish moving average crossover in Figure 1, the price rally remained closer to the 50-day MA support-resistance zone. Eventually, a three black crow candlestick formation breached the short-term MA support, and the stock retraced toward the 200-day MA support. The three black crows is a bearish reversal formation, initiating a fresh descending move. The candlestick pattern reversed a weak trend into a developing downtrend in Figure 1. |
| The average directional index (ADX) (14) developed a fresh bearish trend and the full stochastic (14,3,3) plunged below the center line, indicating bearish momentum in the stock. Thereafter, the momentum oscillator struggled in between the 50 and 20 levels, forming an inverted head & shoulders pattern in Figure 1. Although the pattern broke upward, the price rally could not violate the newly formed 200-day MA resistance. Hence, BWP remained range-bound between the two moving averages. Currently, the indicators in Figure 1 are not strong enough to trigger a bullish breakout. However, traders can track this stock and trigger a long position at a breakout point in the next few trading sessions. Note that the best buying levels will be above 27.50 levels. |
|
| FIGURE 1: BWP, DAILY. The high formed by the first candlestick of the three black crows pattern would be the robust resistance level for the breakout journey. |
| Graphic provided by: StockCharts.com. |
| |
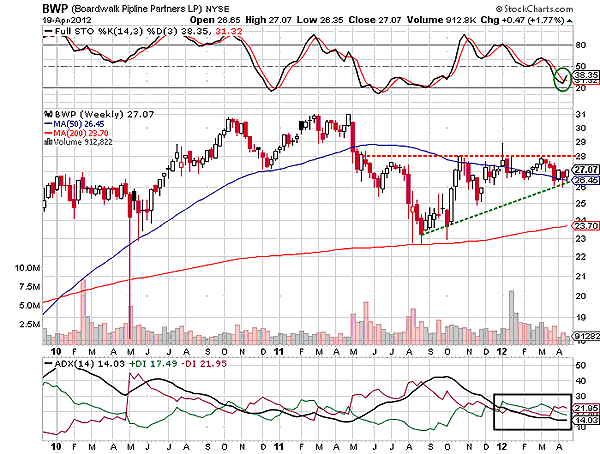
| During the volatile bearish price action, BWP formed an ascending triangle on the weekly time frame chart in Figure 2. An overheated downtrend plunged from 40 levels, generating a bullish reversal possibility for the stock. This situation was favorable for bulls. Though the buying and selling pressure was equal, the stock formed an ascending triangle -- a bullish reversal formation. The lower converging trendline, which is also known as a buyer's line, has narrowed the price action. The pattern would mature in the near future, resulting in a new bullish breakout for BWP. The seller's line (upper trendline) is the tough resistance to be breached. |
|
| FIGURE 2: BWP, WEEKLY |
| Graphic provided by: StockCharts.com. |
| |
| The stochastic oscillator looks ready to surge from 30 levels. But for the confirmed bullish momentum, traders have to wait till the indicator sustains above 50 levels. The ADX (14) is signifying a weak trend, and therefore, to develop a fresh uptrend, the trend indicator has to rush above 20 levels with huge buying pressure. Currently, the selling and buying pressure is equal. Hence, the consolidated price action would continue till the uptrend is developed. |
| You may have to wait a while to see a bullish breakout in BWP. But it looks like the stock is gearing up for the breakout. |
Active trader in the Indian stock markets since 2003 and a full-time writer. Trading is largely based upon technical analysis.
| Company: | Independent |
| Address: | C1/3 Parth Indraprasth Towers. Vastrapur |
| Ahmedabad, Guj 380015 | |
| E-mail address: | chaitalimohile@yahoo.co.in |
Traders' Resource Links | |
| Independent has not added any product or service information to TRADERS' RESOURCE. | |
Click here for more information about our publications!
PRINT THIS ARTICLE

Request Information From Our Sponsors
- StockCharts.com, Inc.
- Candle Patterns
- Candlestick Charting Explained
- Intermarket Technical Analysis
- John Murphy on Chart Analysis
- John Murphy's Chart Pattern Recognition
- John Murphy's Market Message
- MurphyExplainsMarketAnalysis-Intermarket Analysis
- MurphyExplainsMarketAnalysis-Visual Analysis
- StockCharts.com
- Technical Analysis of the Financial Markets
- The Visual Investor
- VectorVest, Inc.
- Executive Premier Workshop
- One-Day Options Course
- OptionsPro
- Retirement Income Workshop
- Sure-Fire Trading Systems (VectorVest, Inc.)
- Trading as a Business Workshop
- VectorVest 7 EOD
- VectorVest 7 RealTime/IntraDay
- VectorVest AutoTester
- VectorVest Educational Services
- VectorVest OnLine
- VectorVest Options Analyzer
- VectorVest ProGraphics v6.0
- VectorVest ProTrader 7
- VectorVest RealTime Derby Tool
- VectorVest Simulator
- VectorVest Variator
- VectorVest Watchdog