HOT TOPICS LIST
- MACD
- Fibonacci
- RSI
- Gann
- ADXR
- Stochastics
- Volume
- Triangles
- Futures
- Cycles
- Volatility
- ZIGZAG
- MESA
- Retracement
- Aroon
INDICATORS LIST
LIST OF TOPICS
PRINT THIS ARTICLE
by Koos van der Merwe
A buy signal is given on the vote line. Let us study the charts.
Position: Accumulate
Koos van der Merwe
Has been a technical analyst since 1969, and has worked as a futures and options trader with First Financial Futures in Johannesburg, South Africa.
PRINT THIS ARTICLE
FIBONACCI
Toromont Industries Signal Says Buy
04/25/12 10:25:52 AMby Koos van der Merwe
A buy signal is given on the vote line. Let us study the charts.
Position: Accumulate
| Using a program that analyzes more than 2000 securities, Toromont Industries gave me a buy signal. The charts here show why. |

|
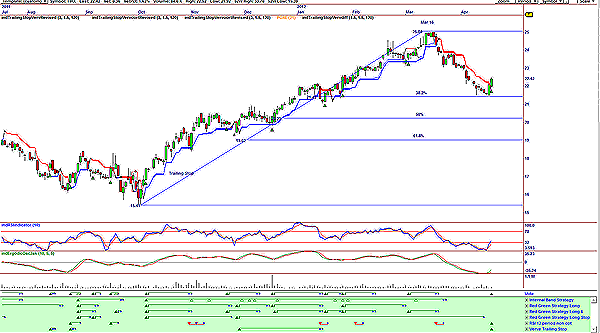
| FIGURE 1: TOROMONT, DAILY |
| Graphic provided by: Omnitrader. |
| |
| Figure 1 is a chart showing the vote line that gave me a buy signal based on the RSI 12-period strategy. A look at the chart shows that the price also broke above the trailing stop line, confirming the signal. The relative strength index (RSI) indicator and the Ind ergodic oscillator shown on the chart both gave buy signals. Volume is however light, but it did strengthen as the price rose on the April 18. The chart also shows that the price tested and found support on the 38.2% retracement level. At a price of $22.42, the closing price of April 18, and a possible target of $25.00, the high of March 16, the share truly looks interesting. |

|
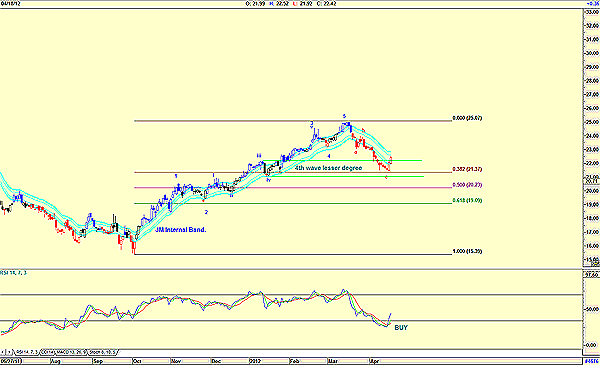
| FIGURE 2: TOROMONT, DAILY, WITH WAVE COUNT |
| Graphic provided by: AdvancedGET. |
| |
| Figure 2 shows the Elliot wave count completed the c-wave correction on the 38.2% Fibonacci retracement level. Note that the c-wave was with the fourth wave of lesser degree. The RSI, in this instance a 14 period, has given a buy signal. The price has not given a buy signal on the JM internal band indicator by breaking above the upper band. The XTL parameter that changes the color of the candlesticks uses a statistical evaluation of the market and tells the difference between market noise and trends. At the moment the bars are red, which means that a buy signal has not yet been given. Figure 1 is giving a buy signal. Figure 2, even though the Elliott wave count is complete and follows the first rule, namely the count must look right, has not yet given a buy signal. Traders could therefore buy at present levels. Investors could wait for a break above the upper JM internal band line, or a change in color of the candlestick price. Definitely a share to watch. |
Has been a technical analyst since 1969, and has worked as a futures and options trader with First Financial Futures in Johannesburg, South Africa.
| Address: | 3256 West 24th Ave |
| Vancouver, BC | |
| Phone # for sales: | 6042634214 |
| E-mail address: | petroosp@gmail.com |
Click here for more information about our publications!
PRINT THIS ARTICLE

|

Request Information From Our Sponsors
- StockCharts.com, Inc.
- Candle Patterns
- Candlestick Charting Explained
- Intermarket Technical Analysis
- John Murphy on Chart Analysis
- John Murphy's Chart Pattern Recognition
- John Murphy's Market Message
- MurphyExplainsMarketAnalysis-Intermarket Analysis
- MurphyExplainsMarketAnalysis-Visual Analysis
- StockCharts.com
- Technical Analysis of the Financial Markets
- The Visual Investor
- VectorVest, Inc.
- Executive Premier Workshop
- One-Day Options Course
- OptionsPro
- Retirement Income Workshop
- Sure-Fire Trading Systems (VectorVest, Inc.)
- Trading as a Business Workshop
- VectorVest 7 EOD
- VectorVest 7 RealTime/IntraDay
- VectorVest AutoTester
- VectorVest Educational Services
- VectorVest OnLine
- VectorVest Options Analyzer
- VectorVest ProGraphics v6.0
- VectorVest ProTrader 7
- VectorVest RealTime Derby Tool
- VectorVest Simulator
- VectorVest Variator
- VectorVest Watchdog
