HOT TOPICS LIST
- MACD
- Fibonacci
- RSI
- Gann
- ADXR
- Stochastics
- Volume
- Triangles
- Futures
- Cycles
- Volatility
- ZIGZAG
- MESA
- Retracement
- Aroon
INDICATORS LIST
LIST OF TOPICS
PRINT THIS ARTICLE
by Koos van der Merwe
Why is it that the bears hug the TV networks and the newspaper reporters? Is the fear of losing money the reason?
Position: Buy
Koos van der Merwe
Has been a technical analyst since 1969, and has worked as a futures and options trader with First Financial Futures in Johannesburg, South Africa.
PRINT THIS ARTICLE
ELLIOTT WAVE
Is A Correction On The Horizon?
04/23/12 11:50:30 AMby Koos van der Merwe
Why is it that the bears hug the TV networks and the newspaper reporters? Is the fear of losing money the reason?
Position: Buy
| When I listen to my favorite TV channels on finance, the announcers always make a big thing of the bears. They always seem to ignore the fact that the market is in a bull trend that my analysis shows will be in place for the next four years. Of course, there will be corrections on the way up, and the bears will stand on the rooftops and shout, "I told you so!" You will never find a bull there. Okay, so let us look at the latest charts. |

|
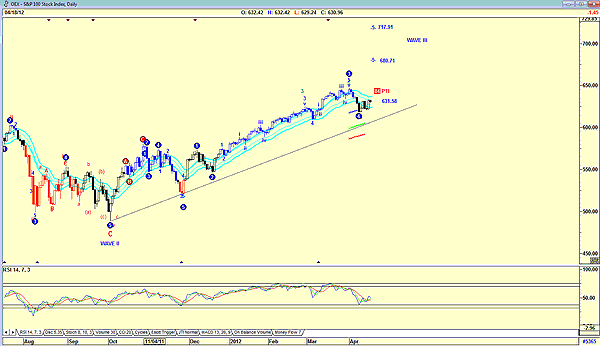
| FIGURE 1. OEX ELLIOTT WAVE COUNT |
| Graphic provided by: AdvancedGET. |
| |
| Figure 1 is a chart of the Standard & Poor's 100. The Elliott wave count on the chart is a wave count calculated by the program Advanced GET. This count suggests that wave 4 of wave III is complete and that the index is now rising in wave 5 of wave III. The chart is suggesting two targets for wave 5. The first is 680.71 and the second is 717.91, with a PTI (probability trend index) of 84%. With the index at 631.58 at the time of this writing, this is a comfortable rise. Of course, when the share completes that fifth wave and corrects, the bears will start claim victory once again and depress the market with the shouting. What they do not realize is that the correction, even though larger than the waves 3, 4 correction shown on the charts, will not be a truly big one. The big correction will be when wave 5 of wave III is completed, and wave IV falls to basically where the index is today. Then, of course, wave V will push the market even higher. No bulls will be interviewed or shout, but when the major ABC correction then occurs, the sound of the bears will be deafening. So when do I estimate this will all occur? To answer this question, we must look at Figure 2. |

|
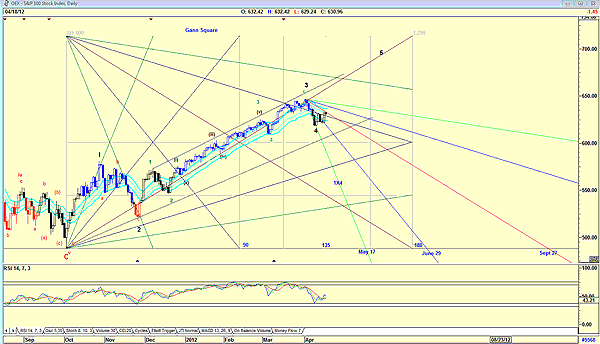
| FIGURE 2: OEX GANN CHART |
| Graphic provided by: AdvancedGET. |
| |
| Figure 2 shows a 90-degree Gann square, and a 180-degree Gann square. I use this type of chart to project possible dates that I watch carefully as the index approaches them. The first date is May 17, where the 1x4 line (green) drawn from the high of wave 3 crosses the horizontal line drawn from the low of wave C, the start of the current rise. Will this truly be the top of wave 5? Well, the "Sell in May and go away" mantra does come to mind. Whether it will be earlier than May 17 or later is very possible, but whatever the actual date is, I have been given a clue. Note the other dates suggested by the Gann fan, June 29 and September 27. June 29 could be the end of the wave 5 correction, with September 27 suggesting the start of the major ABC correction. Whether the dates are true or not does not matter at the moment. Events may change them, but they do give a guideline to plan future investments. Yes, there will be a major correction that will occur sometime this year, but for the moment, use any and every correction to add to your portfolio. Do keep in mind that the index is in a wave 5, with a top suggested May 17. Do keep your stops tight to take advantage of it. |
Has been a technical analyst since 1969, and has worked as a futures and options trader with First Financial Futures in Johannesburg, South Africa.
| Address: | 3256 West 24th Ave |
| Vancouver, BC | |
| Phone # for sales: | 6042634214 |
| E-mail address: | petroosp@gmail.com |
Click here for more information about our publications!
Comments

Request Information From Our Sponsors
- StockCharts.com, Inc.
- Candle Patterns
- Candlestick Charting Explained
- Intermarket Technical Analysis
- John Murphy on Chart Analysis
- John Murphy's Chart Pattern Recognition
- John Murphy's Market Message
- MurphyExplainsMarketAnalysis-Intermarket Analysis
- MurphyExplainsMarketAnalysis-Visual Analysis
- StockCharts.com
- Technical Analysis of the Financial Markets
- The Visual Investor
- VectorVest, Inc.
- Executive Premier Workshop
- One-Day Options Course
- OptionsPro
- Retirement Income Workshop
- Sure-Fire Trading Systems (VectorVest, Inc.)
- Trading as a Business Workshop
- VectorVest 7 EOD
- VectorVest 7 RealTime/IntraDay
- VectorVest AutoTester
- VectorVest Educational Services
- VectorVest OnLine
- VectorVest Options Analyzer
- VectorVest ProGraphics v6.0
- VectorVest ProTrader 7
- VectorVest RealTime Derby Tool
- VectorVest Simulator
- VectorVest Variator
- VectorVest Watchdog
