HOT TOPICS LIST
- MACD
- Fibonacci
- RSI
- Gann
- ADXR
- Stochastics
- Volume
- Triangles
- Futures
- Cycles
- Volatility
- ZIGZAG
- MESA
- Retracement
- Aroon
INDICATORS LIST
LIST OF TOPICS
PRINT THIS ARTICLE
by Donald W. Pendergast, Jr.
Shares of McKesson Corp. rose by more than 222% between late November 2008 and mid-April 2012. Does this stock have some more bullish ground to cover, or is a major trend reversal coming up?
Position: N/A
Donald W. Pendergast, Jr.
Donald W. Pendergast is a financial markets consultant who offers specialized services to stock brokers and high net worth individuals who seek a better bottom line for their portfolios.
PRINT THIS ARTICLE
TRADING SYSTEMS
MCK Ready To Rise After Support Test?
04/23/12 09:08:01 AMby Donald W. Pendergast, Jr.
Shares of McKesson Corp. rose by more than 222% between late November 2008 and mid-April 2012. Does this stock have some more bullish ground to cover, or is a major trend reversal coming up?
Position: N/A
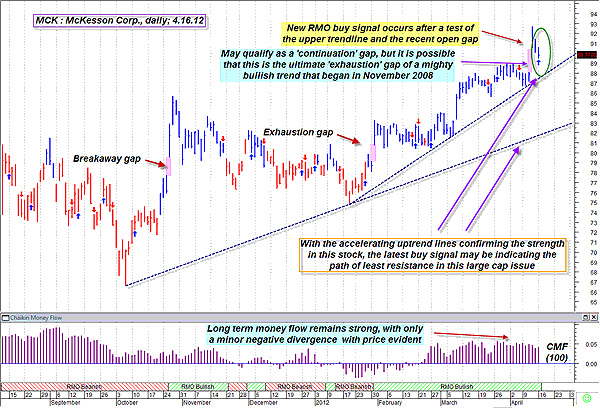
| While the pathway from its November 2008 low of 28.72 to its April 2012 high of 92.69 wasn't exactly as straight as an arrow, it still cannot be refuted that shares of McKesson Corp. (MCK) have enjoyed a substantial bullish trend over the past 40-some months, despite some pullbacks along the way. Does this large-cap, dividend-yielding stock have more room to rise, or is its recent bullish gap a final warning that the stock is due for a major trend reversal? Here's a closer look at MCK's daily chart now (Figure 1). |

|
| FIGURE 1: MCK, DAILY. As you exaamine this chart of McKesson Corp., if your reaction is something like "Things just could not get any more bullish for this stock," then you may be exactly right, especially since several of MCK's key price cycles are already turning lower, suggesting a substantial correction ahead. |
| Graphic provided by: MetaStock. |
| Graphic provided by: RMO indicators from MetaStock 11. |
| |
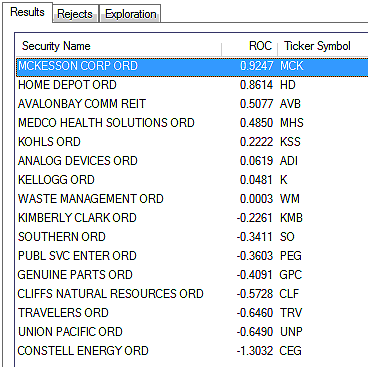
| At first glance, MCK's daily graph depicts a generally bullish image; the accelerating uptrend line is an important technical clue that helps traders and investors discern whether the stock is a good candidate for swing trading and/or covered calls, as is the bullish long-term money flow situation, as shown by the 100-period Chaikin money flow histogram (CMF)(100) at the lower portion of the chart. MCK also has excellent 13-week comparative relative strength versus the .SPX, making it potentially attractive to institutional investors seeking to put their money onto a "train" that's already moving in the desired direction. Beyond these ostensibly bullish factors, the RMO (Rahul Mohindar) trading system from MetaStock 11 has just fired a long entry signal, one that will trigger a potential trade entry on a rise above Monday's high of 90.60. See Figure 2. Even better for bull, the stock recently completed a successful test of trendline support on April 10, 2012. So, based on these findings, we can say that MCK has been and is currently in a long-term bull market. However, there is more to the picture here -- two separate technical factors that may be acting as early warning signs that MCK may have more bearish plans in mind in the weeks and months ahead. |

|
| FIGURE 2: RELATIVE STRENGTH. The highest relative strength large-cap stocks firing RMO swing buy signals at the close of trading on April 16, 2012. |
| Graphic provided by: MetaStock. |
| Graphic provided by: MetaStock Explorer. |
| |
| The recent, substantial, bullish gap may be what is known as an exhaustion gap -- the kind that typically shows up near the end of a wildly bullish run in a stock or exchange traded fund (ETF). Even during the most recent rally in MCK, there seems to be ample evidence that the gap of October 21, 2011, was a breakaway gap, with the gap of January 31, 2012, being a continuation gap. If those labelings are correct, then the gap of three sessions ago is more than likely an exhaustion gap. When you also consider that several key price cycles in MCK have already turned lower -- implying an upcoming correction in the stock -- you begin to see that caution may now be warranted if attempting to play MCK on the long side. One way to consider playing this new RMO buy signal here may be to go long on a break above 90.60, using the recent swing high at 92.69 as the rational price target. The area directly surrounding that price area will no doubt be a battleground between highly confident bulls and forward-looking bears, so why not just avoid the expected volatility and just close out a winning move as the stock approaches that resistance area? As for an initial/trailing stop, perhaps using the trigger bar's low of 89.40 as your initial loss-protection point would make sense before following up with a two-bar trailing stop of the daily lows until either the price target is reached or the trade stops out. Risking no more than 2% of your account equity on such a trade might also be an excellent idea, too. The broad US markets are staging a minor relief rally now, so be nimble and think like a trader if choosing to trade MCK on the long side on this particular setup. |
Donald W. Pendergast is a financial markets consultant who offers specialized services to stock brokers and high net worth individuals who seek a better bottom line for their portfolios.
| Title: | Writer, market consultant |
| Company: | Linear Trading Systems LLC |
| Jacksonville, FL 32217 | |
| Phone # for sales: | 904-239-9564 |
| E-mail address: | lineartradingsys@gmail.com |
Traders' Resource Links | |
| Linear Trading Systems LLC has not added any product or service information to TRADERS' RESOURCE. | |
Click here for more information about our publications!
PRINT THIS ARTICLE

Request Information From Our Sponsors
- StockCharts.com, Inc.
- Candle Patterns
- Candlestick Charting Explained
- Intermarket Technical Analysis
- John Murphy on Chart Analysis
- John Murphy's Chart Pattern Recognition
- John Murphy's Market Message
- MurphyExplainsMarketAnalysis-Intermarket Analysis
- MurphyExplainsMarketAnalysis-Visual Analysis
- StockCharts.com
- Technical Analysis of the Financial Markets
- The Visual Investor
- VectorVest, Inc.
- Executive Premier Workshop
- One-Day Options Course
- OptionsPro
- Retirement Income Workshop
- Sure-Fire Trading Systems (VectorVest, Inc.)
- Trading as a Business Workshop
- VectorVest 7 EOD
- VectorVest 7 RealTime/IntraDay
- VectorVest AutoTester
- VectorVest Educational Services
- VectorVest OnLine
- VectorVest Options Analyzer
- VectorVest ProGraphics v6.0
- VectorVest ProTrader 7
- VectorVest RealTime Derby Tool
- VectorVest Simulator
- VectorVest Variator
- VectorVest Watchdog
