HOT TOPICS LIST
- MACD
- Fibonacci
- RSI
- Gann
- ADXR
- Stochastics
- Volume
- Triangles
- Futures
- Cycles
- Volatility
- ZIGZAG
- MESA
- Retracement
- Aroon
INDICATORS LIST
LIST OF TOPICS
PRINT THIS ARTICLE
by Billy Williams
The market has been pulling back during a transitional month, but is it about to go higher?
Position: Buy
Billy Williams
Billy Williams has been trading the markets for 27 years, specializing in momentum trading with stocks and options.
PRINT THIS ARTICLE
TECHNICAL ANALYSIS
Market Rebounds, But Is It About To Go Higher?
04/20/12 11:34:12 AMby Billy Williams
The market has been pulling back during a transitional month, but is it about to go higher?
Position: Buy
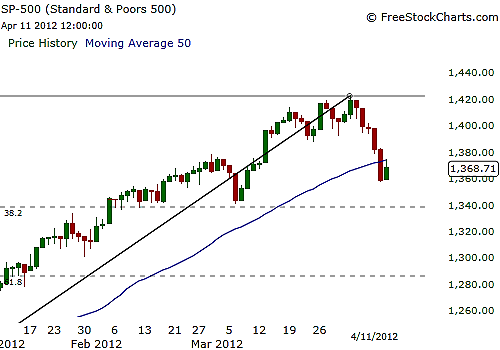
| After a remarkable runup followed by a series of disappointing down days, including SPX closing below its 50-day moving average for the first time since December this past Tuesday, the level provided technical resistance to its rebound on Wednesday. Now, price is near the 50-day moving average close to 1,373 -- Wednesday's session high. Though Wednesday's price action was a positive turning point considering the recent decline, the SPX still has some ways to go if it wants to go higher. The reason for this is found in the recent upturn that formed an inside bar on the SPX's daily price chart (Figure 1). On an intraday basis, price then retraced greater than the previous bearish price bar by greater than 55%, a strong indicator that a market reversal had taken place where control of price has been passed from the bears to the bulls. Sadly, the inside bar's close was weak and though the retracement is a positive for the bulls, that it didn't close near its intraday high indicates at least some doubt as to how strong a control the bulls actually have over price. |

|
| FIGURE 1: S&P 500. The SPX has been on a major bull run but is pulling back with the 0.382 Fib retracement zone and finding support along the 50-day simple moving average (SMA), where it formed a bullish inside bar. Will price resume its run from here? |
| Graphic provided by: www.freestockcharts.com. |
| |
| That said, the pullback is well within the 0.382 Fibonacci retracement from the recent bull run, and it was expected that price would pull back and take a breather at some point, considering the breathtaking run the market has experienced since December 20, 2011. The shallow Fibonacci retracement level in this price zone tells you that if the turn in the market has legs, then as a general guideline, price from this level will then trade back to the former price move that preceded the pullback and likely exceed it. Add to that, a three- to five-price bar drop after a big run and on the first primary pullback is an actionable trade in and of itself. |

|
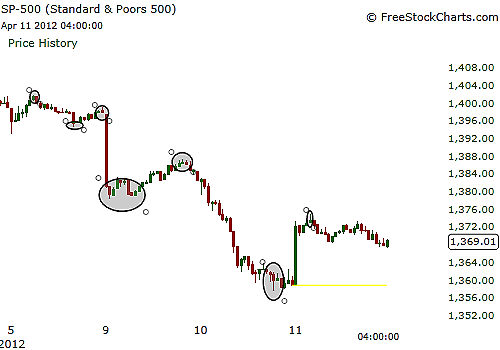
| FIGURE 2: S&P 500. Price has formed a steady series of lower highs and lower lows, but will that be broken now that the bullish inside bar has retraced more than 55% of the previous bearish price bar, a potentially strong indicator of an attempt to go higher? |
| Graphic provided by: www.freestockcharts.com. |
| |
| Even more, May is on the horizon and is historically the most bullish month of the year with April usually a "setup month," where price experiences a pullback or begins to form a first-stage base before taking off in another bullish run to the upside. See Figure 2. So the technical factors are compelling and, as for the fundamental side, you can recently take note that there is an encouraging start to earnings season where the S&P financial sector index rose 1.6%, Bank of America gained 3.7% to $8.86, and Alcoa rose 6.3% to $9.90 a day after the Dow component reported a surprise first-quarter profit, increasing confidence that there will likely be a strong earnings season. |
| After the Federal Reserve said rising energy costs were a concern for economic growth, the stock market cut gains to adjust for the future economic impact that could spill over from any negative impact on the part of the energy markets to the consumer. Atlanta Fed president Dennis Lockhart was also quoted as saying that the economy would have to get a lot worse before the central bank would offer more stimulus. |
| Sectors linked with economic growth led the way higher as their recently beaten-down prices made them attractive to bargain hunters. So how do you play this and make money? Look for the market to trade in favor of the bulls, but watch for whipsawing price action as bears try to put up a fight. Market volatility will peak in May, so trade in the short term and use call options to limit risk while maximizing leverage during that time. If you go long, look for options with a delta of 0.80 or higher and trade the June or July calls, but you can also consider bull put spreads if you want to hedge your downside. |
Billy Williams has been trading the markets for 27 years, specializing in momentum trading with stocks and options.
| Company: | StockOptionSystem.com |
| E-mail address: | stockoptionsystem.com@gmail.com |
Traders' Resource Links | |
| StockOptionSystem.com has not added any product or service information to TRADERS' RESOURCE. | |
Click here for more information about our publications!
PRINT THIS ARTICLE

Request Information From Our Sponsors
- StockCharts.com, Inc.
- Candle Patterns
- Candlestick Charting Explained
- Intermarket Technical Analysis
- John Murphy on Chart Analysis
- John Murphy's Chart Pattern Recognition
- John Murphy's Market Message
- MurphyExplainsMarketAnalysis-Intermarket Analysis
- MurphyExplainsMarketAnalysis-Visual Analysis
- StockCharts.com
- Technical Analysis of the Financial Markets
- The Visual Investor
- VectorVest, Inc.
- Executive Premier Workshop
- One-Day Options Course
- OptionsPro
- Retirement Income Workshop
- Sure-Fire Trading Systems (VectorVest, Inc.)
- Trading as a Business Workshop
- VectorVest 7 EOD
- VectorVest 7 RealTime/IntraDay
- VectorVest AutoTester
- VectorVest Educational Services
- VectorVest OnLine
- VectorVest Options Analyzer
- VectorVest ProGraphics v6.0
- VectorVest ProTrader 7
- VectorVest RealTime Derby Tool
- VectorVest Simulator
- VectorVest Variator
- VectorVest Watchdog
