HOT TOPICS LIST
- MACD
- Fibonacci
- RSI
- Gann
- ADXR
- Stochastics
- Volume
- Triangles
- Futures
- Cycles
- Volatility
- ZIGZAG
- MESA
- Retracement
- Aroon
INDICATORS LIST
LIST OF TOPICS
PRINT THIS ARTICLE
by Matt Blackman
Since peaking in early April, the S&P 500 has struggled. But if the pattern now forming on the index is confirmed, look for more downside action through the summer.
Position: N/A
Matt Blackman
Matt Blackman is a full-time technical and financial writer and trader. He produces corporate and financial newsletters, and assists clients in getting published in the mainstream media. He is the host of TradeSystemGuru.com. Matt has earned the Chartered Market Technician (CMT) designation. Find out what stocks and futures Matt is watching on Twitter at www.twitter.com/RatioTrade
PRINT THIS ARTICLE
HEAD & SHOULDERS
Bearish Omen For US Stocks?
04/19/12 08:28:27 AMby Matt Blackman
Since peaking in early April, the S&P 500 has struggled. But if the pattern now forming on the index is confirmed, look for more downside action through the summer.
Position: N/A
| How many US stock traders are aware of what has been happening to stocks north of the border? While stocks have struggled, bullish pundits such as Jeremy Segal, who is calling for a Dow 15,000 by year-end, point to the fact that the recent correction is just a pause in the rally. But this argument ignores the very real headwinds blowing against commodities clearly demonstrated by Canadian stocks. |
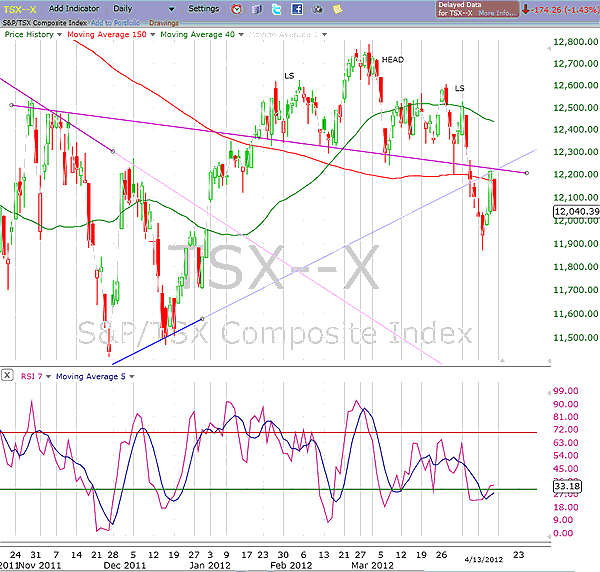
| As we see in Figure 1, the resource-heavy Toronto TSX Index recently completed a bearish head & shoulders top pattern with a downsloping neckline near 12,200. Perhaps more bearish is the fact that the most recent peak in February 2012 is well off the 2011 peak above 14,300, which puts the index in a confirmed intermediate downtrend. Further, the 2011 TSX predates the peak in the Commodity Research Bureau Index (CRB) by more than a month. |

|
| FIGURE 1: TSX, DAILY. The daily chart of the Toronto TSX Index showing the 2012 head & shoulders top pattern. The head at the peak of 12,788 is well off the March-April 2011 peak above 14,300 (not shown). |
| Graphic provided by: FreeStockCharts.com. |
| |
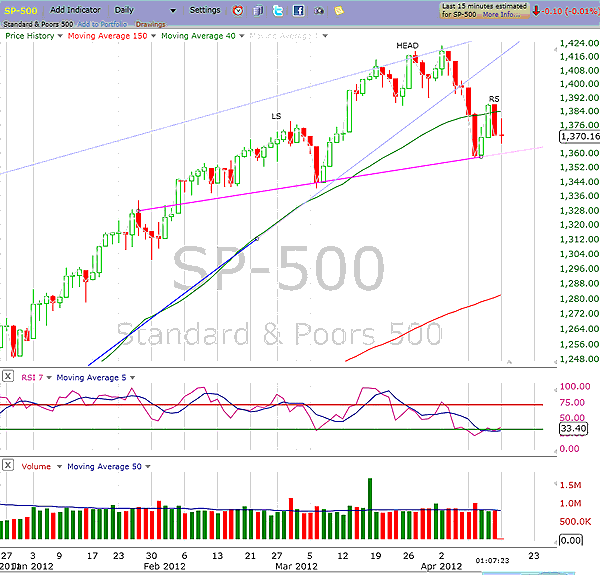
| Can stocks continue to rally in the face of declining commodity and commodity stock prices? One major premise of technical analysis is the idea of intermarket correlation between different asset classes. In a classic rally, bonds rally first, followed by stocks, then commodities. Although this relationship has changed somewhat in the last few years where commodities have moved ahead of US stocks, the fact that commodities are falling is not good news for stocks. If this relationship continues, it suggests that the H&S pattern now forming in the SPX will be confirmed and stocks will continue to head lower. See Figure 2. |

|
| FIGURE 2: SPX, DAILY. The daily chart of the SPX showing what looks like a bearish head & shoulders top pattern nearing completion with the upsloping neckline around 1365. A breach of this on volume would confirm the pattern and be very bearish for the index and the US stock market in general. |
| Graphic provided by: FreeStockCharts.com. |
| |
| However, there is a caveat to this outlook -- the Federal Reserve balance sheet. In an April 15th article (http://goo.gl/LaLNe), The Big Picture's David Kotok makes the argument that the normal seasonal weakness at this time of the year may not occur. If the Federal Reserve and the European Central Bank engage in more stimuli such as Quantitative Easing 3 or more bond purchases ("Operation Twist"), stocks could enjoy another lift. Chances of this occurring are higher, given that this is an election year in the US. But the question remains: how much stimulus will be needed to offset both economic weakness and falling commodity prices? |
| Our forecast? Look for stormy stock seas with the possibility of central bank cash-generated calm as the Presidential election draws near. |
Matt Blackman is a full-time technical and financial writer and trader. He produces corporate and financial newsletters, and assists clients in getting published in the mainstream media. He is the host of TradeSystemGuru.com. Matt has earned the Chartered Market Technician (CMT) designation. Find out what stocks and futures Matt is watching on Twitter at www.twitter.com/RatioTrade
| Company: | TradeSystemGuru.com |
| Address: | Box 2589 |
| Garibaldi Highlands, BC Canada | |
| Phone # for sales: | 604-898-9069 |
| Fax: | 604-898-9069 |
| Website: | www.tradesystemguru.com |
| E-mail address: | indextradermb@gmail.com |
Traders' Resource Links | |
| TradeSystemGuru.com has not added any product or service information to TRADERS' RESOURCE. | |
Click here for more information about our publications!
PRINT THIS ARTICLE

Request Information From Our Sponsors
- StockCharts.com, Inc.
- Candle Patterns
- Candlestick Charting Explained
- Intermarket Technical Analysis
- John Murphy on Chart Analysis
- John Murphy's Chart Pattern Recognition
- John Murphy's Market Message
- MurphyExplainsMarketAnalysis-Intermarket Analysis
- MurphyExplainsMarketAnalysis-Visual Analysis
- StockCharts.com
- Technical Analysis of the Financial Markets
- The Visual Investor
- VectorVest, Inc.
- Executive Premier Workshop
- One-Day Options Course
- OptionsPro
- Retirement Income Workshop
- Sure-Fire Trading Systems (VectorVest, Inc.)
- Trading as a Business Workshop
- VectorVest 7 EOD
- VectorVest 7 RealTime/IntraDay
- VectorVest AutoTester
- VectorVest Educational Services
- VectorVest OnLine
- VectorVest Options Analyzer
- VectorVest ProGraphics v6.0
- VectorVest ProTrader 7
- VectorVest RealTime Derby Tool
- VectorVest Simulator
- VectorVest Variator
- VectorVest Watchdog
