HOT TOPICS LIST
- MACD
- Fibonacci
- RSI
- Gann
- ADXR
- Stochastics
- Volume
- Triangles
- Futures
- Cycles
- Volatility
- ZIGZAG
- MESA
- Retracement
- Aroon
INDICATORS LIST
LIST OF TOPICS
PRINT THIS ARTICLE
by Donald W. Pendergast, Jr.
With shares of Earthlink failing to take out their February 2012 high, is this stock now destined to drop down toward $7 again?
Position: N/A
Donald W. Pendergast, Jr.
Donald W. Pendergast is a financial markets consultant who offers specialized services to stock brokers and high net worth individuals who seek a better bottom line for their portfolios.
PRINT THIS ARTICLE
Earthlink Heading For A Cycle Low Near $7?
04/19/12 12:10:58 PMby Donald W. Pendergast, Jr.
With shares of Earthlink failing to take out their February 2012 high, is this stock now destined to drop down toward $7 again?
Position: N/A
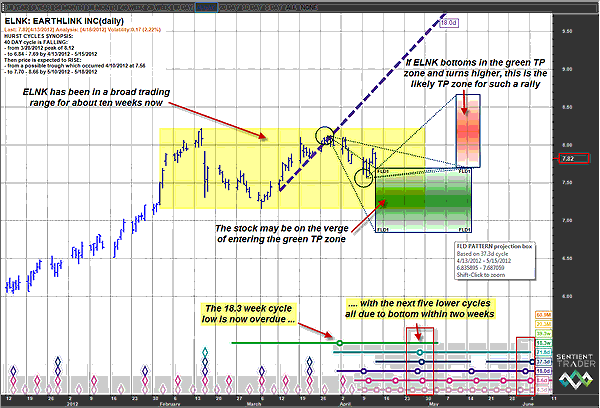
| Shares of Earthlink (ELNK) had a very nice run from late November 2011 through mid-February 2012, ultimately rising by nearly 38% before pulling back to the low $7.00 range in early March 2012. The stock made a valiant attempt to meet and/or exceed the February high of 8.22 but failed, and has apparently entered into a trend reversal phase, one that may not find another meaningful low until its next multicycle low is due, possibly by late April/early May 2012. Here's a closer look now (Figure 1). |

|
| FIGURE 1: ELNK, DAILY. Having a general idea of where the key support/resistance levels are in your favorite stock can come in very handy, especially if you know when the approximate time windows for several key price cycles to form a tradable low are due. |
| Graphic provided by: Sentient Trader. |
| |
| When ELNK not only failed to exceed its February 2012 high of $8.22 but then went right on to break its 18-day VTL (the dashed blue "valid trendline"), it not only confirmed the fact that the stock was likely to correct further, it also confirmed that the stock's 37.3-day cycle high was in place. Not surprisingly, ELNK has continued to drift lower over the past two weeks and has not yet begun to enter into the green time/price (TP) projection zone highlighted on its daily chart. That TP zone is suggesting that ELNK could fall as far as $6.84 per share by May 14, 2012, nearly a full dollar below Friday's closing value of $7.82. As we glance at the bottom of the chart, we find that one of the larger cycles identified -- the 18.3-week cycle -- is now overdue to make a low and that the next five lower cycles are all anticipated to combine into a multicycle low within the next two weeks. ELNK is still enmeshed in a minor downtrend/and/or consolidation pattern, so it would be wise to watch the stock and note what happens if/when it drops down into the TP zone, especially in the days leading up to May 1. For all any technician knows, this could be the general time window that the overdue 18.3-week cycle finally bottoms out -- along with all of the others -- forming a solid low in ELNK that bullish traders and investors can latch onto and perhaps profit from. |

|
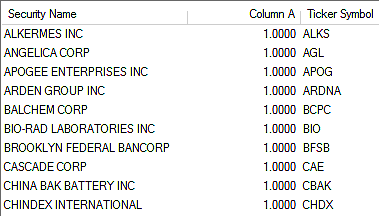
| FIGURE 2: SWING SELL SIGNALS. Ten small-cap stocks firing RMO (Rahil Mohindar) swing sell signals for April 13, 2012. |
| Graphic provided by: MetaStock. |
| Graphic provided by: MetaStock Explorer. |
| |
| Should ELNK bottom out in the green TP zone and then turn higher, the red shades TP zone offers Sentient Trader's best thinking about where the stock may rally toward, and in what general time frame. In this case, the anticipated price target range stretches from $7.70 to $8.66 and the time window runs from May 10 through May 18. The yellow shaded box on the chart highlights the general trading range that ELNK has been mired in since late January 2012; a break above $8.22 is what is needed for the stock to break free and then possibly make it to the top end of the red TP zone. ELNK's medium-term/long-term money flows remain in bullish territory (based on the 34- and 100-period Chaikin money flows [not shown]), which also offers some good news for bulls looking to build a position in this stock once it finally bottoms again and turns back up. In the here and now, traders need to monitor the stock for tell-tale signs of a cycle low, one of the primary confirmations of a bullish turn will be when (and if) ELNK manages to print a bullish reversal bar sometime during the upcoming multicycle low time window. A subsequent break above that bar's high might be the tipoff that ELNK intends to pursue a new, more bullish pathway in the weeks following. See Figure 2. |
| Even though price cycle analysis isn't a perfect technical science, it can still help prepare traders to be ready for future price moves, sometimes days, weeks, or even months in advance of a tradable market turn. |
Donald W. Pendergast is a financial markets consultant who offers specialized services to stock brokers and high net worth individuals who seek a better bottom line for their portfolios.
| Title: | Writer, market consultant |
| Company: | Linear Trading Systems LLC |
| Jacksonville, FL 32217 | |
| Phone # for sales: | 904-239-9564 |
| E-mail address: | lineartradingsys@gmail.com |
Traders' Resource Links | |
| Linear Trading Systems LLC has not added any product or service information to TRADERS' RESOURCE. | |
Click here for more information about our publications!
PRINT THIS ARTICLE

Request Information From Our Sponsors
- StockCharts.com, Inc.
- Candle Patterns
- Candlestick Charting Explained
- Intermarket Technical Analysis
- John Murphy on Chart Analysis
- John Murphy's Chart Pattern Recognition
- John Murphy's Market Message
- MurphyExplainsMarketAnalysis-Intermarket Analysis
- MurphyExplainsMarketAnalysis-Visual Analysis
- StockCharts.com
- Technical Analysis of the Financial Markets
- The Visual Investor
- VectorVest, Inc.
- Executive Premier Workshop
- One-Day Options Course
- OptionsPro
- Retirement Income Workshop
- Sure-Fire Trading Systems (VectorVest, Inc.)
- Trading as a Business Workshop
- VectorVest 7 EOD
- VectorVest 7 RealTime/IntraDay
- VectorVest AutoTester
- VectorVest Educational Services
- VectorVest OnLine
- VectorVest Options Analyzer
- VectorVest ProGraphics v6.0
- VectorVest ProTrader 7
- VectorVest RealTime Derby Tool
- VectorVest Simulator
- VectorVest Variator
- VectorVest Watchdog
