HOT TOPICS LIST
- MACD
- Fibonacci
- RSI
- Gann
- ADXR
- Stochastics
- Volume
- Triangles
- Futures
- Cycles
- Volatility
- ZIGZAG
- MESA
- Retracement
- Aroon
INDICATORS LIST
LIST OF TOPICS
PRINT THIS ARTICLE
by Chaitali Mohile
Dycom Industries has undergone a bearish breakout.
Position: Sell
Chaitali Mohile
Active trader in the Indian stock markets since 2003 and a full-time writer. Trading is largely based upon technical analysis.
PRINT THIS ARTICLE
BREAKOUTS
Dycom Breaks Down
04/18/12 12:04:17 PMby Chaitali Mohile
Dycom Industries has undergone a bearish breakout.
Position: Sell
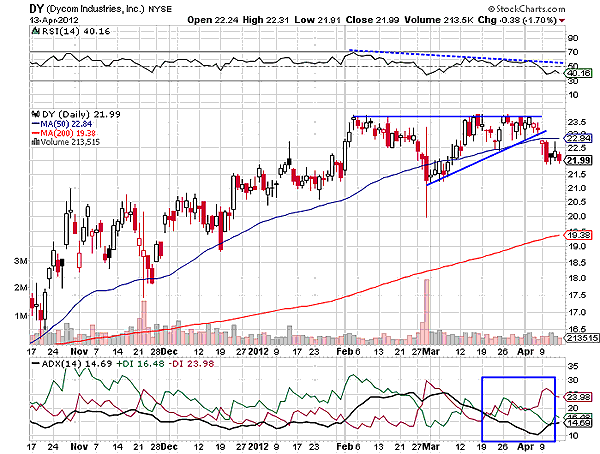
| The rally in Dycom Industries (DY) that started in October 2011 showed some slowing down as it began its sideways move in early February 2012. The slowing down of the trend is further confirmed by the formation of an ascending triangle pattern (Figure 1). Notice from the daily chart of DY in Figure 1 how the 50-day moving average (MA) acted as a strong support level that was challenged frequently by DY. Along with the weakening in the trend, bullish strength was also absent in its price movement. The relative strength index (RSI) (14) in Figure 1 was stuck in between the 50 and 70 levels. Although the oscillator flickered in this range, the rally required a huge bullish force to surge. Later, the volatility and weakness in the oscillators resulted in a consolidation. |

|
| FIGURE 1: DY, DAILY |
| Graphic provided by: StockCharts.com. |
| |
| An ascending triangle formation is a bullish continuation pattern that typically breaks in an upward direction. But the pattern fails if prices break downward, and the breakout is considered to be a major damage for the particular stock/index. In Figure 1 the pattern and the 50-day MA support are broken downward, and therefore, DY is likely to initiate a fresh bearish move. The RSI (14) plunged below the 50 levels, indicating an incoming bearish pressure. Due to the breakout, the selling pressure has increased, but the average directional index (ADX) (14) has dipped below the 20 levels. Thus, DY is likely to enter an intermediate correction phase. |
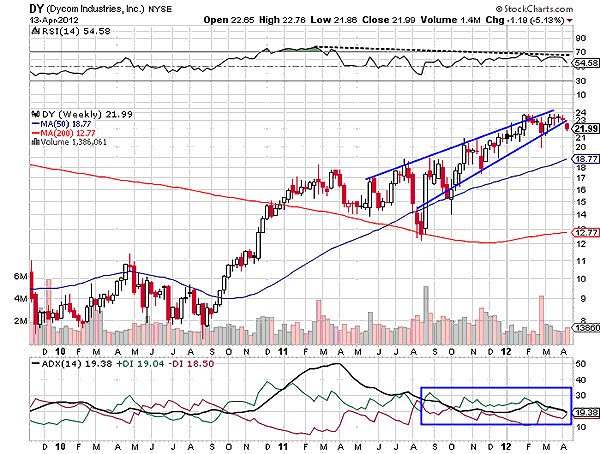
| After a bullish crossover of the two moving averages in the weekly chart of DY in Figure 2, DY moved up in a narrowing range. The stock formed a rising wedge -- a bearish reversal formation. We can see that the upward price action was filled with many doji candlesticks and the other candles had long upper as well as lower shadows. This shows significant uncertainty and volatility. |

|
| FIGURE 2: DY, WEEKLY |
| Graphic provided by: StockCharts.com. |
| |
| The RSI (14) showed a negative divergence and the overheated uptrend plunged to the developing trend region. Thereafter, the bullish trend turned unstable, leading to a bearish breakout of the rising wedge pattern. The potential target of this breakout is measured by subtracting the length of the wedge from the breakout point. However, initially we will observe the price movement near the 50-day MA support. If this support is violated in the future, then the next support of the 200-day moving average (MA) would be the target. |
| The breakdown on the daily and weekly charts indicates huge selling pressure. It could be an opportunity to trigger short positions. This trade is suitable for all types of traders and small investors. |
Active trader in the Indian stock markets since 2003 and a full-time writer. Trading is largely based upon technical analysis.
| Company: | Independent |
| Address: | C1/3 Parth Indraprasth Towers. Vastrapur |
| Ahmedabad, Guj 380015 | |
| E-mail address: | chaitalimohile@yahoo.co.in |
Traders' Resource Links | |
| Independent has not added any product or service information to TRADERS' RESOURCE. | |
Click here for more information about our publications!
PRINT THIS ARTICLE

Request Information From Our Sponsors
- StockCharts.com, Inc.
- Candle Patterns
- Candlestick Charting Explained
- Intermarket Technical Analysis
- John Murphy on Chart Analysis
- John Murphy's Chart Pattern Recognition
- John Murphy's Market Message
- MurphyExplainsMarketAnalysis-Intermarket Analysis
- MurphyExplainsMarketAnalysis-Visual Analysis
- StockCharts.com
- Technical Analysis of the Financial Markets
- The Visual Investor
- VectorVest, Inc.
- Executive Premier Workshop
- One-Day Options Course
- OptionsPro
- Retirement Income Workshop
- Sure-Fire Trading Systems (VectorVest, Inc.)
- Trading as a Business Workshop
- VectorVest 7 EOD
- VectorVest 7 RealTime/IntraDay
- VectorVest AutoTester
- VectorVest Educational Services
- VectorVest OnLine
- VectorVest Options Analyzer
- VectorVest ProGraphics v6.0
- VectorVest ProTrader 7
- VectorVest RealTime Derby Tool
- VectorVest Simulator
- VectorVest Variator
- VectorVest Watchdog
