HOT TOPICS LIST
- MACD
- Fibonacci
- RSI
- Gann
- ADXR
- Stochastics
- Volume
- Triangles
- Futures
- Cycles
- Volatility
- ZIGZAG
- MESA
- Retracement
- Aroon
INDICATORS LIST
LIST OF TOPICS
PRINT THIS ARTICLE
by Bruce Tintelnot
The most important part of a trade is knowing when to exit with a profit. Here's an overview of basic considerations for devising exit strategies.
Position: N/A
Bruce Tintelnot
Bruce Tintelnot is a writer and researcher in the area of business, particularly investing and the economy. His qualifications include a bachelor's degree in business administration with a financial major, online trading experience in the stock and foreign currency markets with a good knowledge of technical analysis and fundamental analysis.
PRINT THIS ARTICLE
MARKET TIMING
Basics For Exit Strategies
04/30/12 11:27:49 AMby Bruce Tintelnot
The most important part of a trade is knowing when to exit with a profit. Here's an overview of basic considerations for devising exit strategies.
Position: N/A
| Trades can be easily entered into at any time, but when is the best time to be exiting a trade with a profit? The most straightforward way of doing this is by drawing support and resistance lines and using them as a guide for profit-taking strategies. Prices usually have a higher probability of changing direction at these areas. |
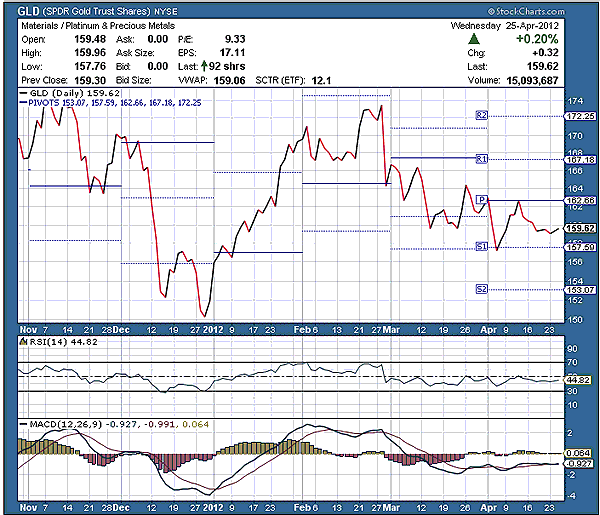
| Exit strategies can be price-based or time-based. Price-based strategies are what beginners should start with, since they are basically just exiting a trade at a price that set by using a strategy. Possible tools that can be used to develop a trading strategy are candlestick chart formations, chart patterns, and almost innumerable technical indicators. Figure 1 shows SPDR GLD Trust Shares -- an exchange traded fund (ETF) -- with the moving average convergence/divergence (MACD), a trend indicator with a histogram interposed on it, and the relative strength index (RSI) to indicate price momentum. The column on the far right shows the most recently calculated pivot point, the thicker line, and the support and resistance levels, the thinner, dotted lines. See Figure 1. |

|
| FIGURE 1: GOLD ETF |
| Graphic provided by: StockCharts.com. |
| |
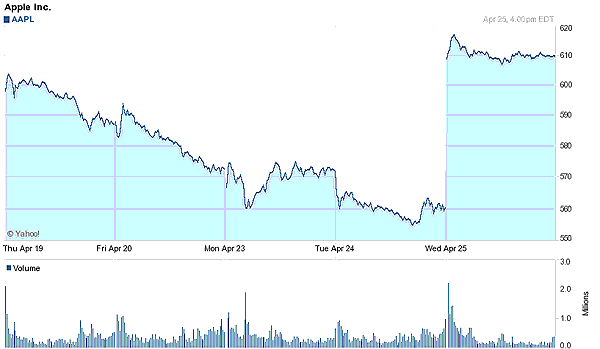
| Time-based exit strategies are devised to be used within a time frame on the trading charts. A trader tries to set a price goal for profit taking in what he considers a window of opportunity. If all goes well for him, his goal will be reached and he can take profits when he exits. If it looks like prices aren't going to get to this point and start going sideways or down, possibly a changing trend, then the trade should be exited. Trading considerations for time-based strategies are event-oriented involving company news releases, geopolitical tensions or destabilization, and extreme or catastrophic geophysical events. Figure 2 shows how Apple's (AAPL) quarterly earnings announcement on April 24, 2012, of $12.30, well above the expectations of the analysts of $10.07, caused a sudden rise in its stock price. See Figure 2. |

|
| FIGURE 2: AAPL |
| Graphic provided by: StockCharts.com. |
| |
Bruce Tintelnot is a writer and researcher in the area of business, particularly investing and the economy. His qualifications include a bachelor's degree in business administration with a financial major, online trading experience in the stock and foreign currency markets with a good knowledge of technical analysis and fundamental analysis.
| Title: | Freelance Writer |
| Website: | textwriter2.webs.com |
| E-mail address: | brucetintelnot@aol.com |
Click here for more information about our publications!
Comments
Date: 05/03/12Rank: 1Comment:

Request Information From Our Sponsors
- StockCharts.com, Inc.
- Candle Patterns
- Candlestick Charting Explained
- Intermarket Technical Analysis
- John Murphy on Chart Analysis
- John Murphy's Chart Pattern Recognition
- John Murphy's Market Message
- MurphyExplainsMarketAnalysis-Intermarket Analysis
- MurphyExplainsMarketAnalysis-Visual Analysis
- StockCharts.com
- Technical Analysis of the Financial Markets
- The Visual Investor
- VectorVest, Inc.
- Executive Premier Workshop
- One-Day Options Course
- OptionsPro
- Retirement Income Workshop
- Sure-Fire Trading Systems (VectorVest, Inc.)
- Trading as a Business Workshop
- VectorVest 7 EOD
- VectorVest 7 RealTime/IntraDay
- VectorVest AutoTester
- VectorVest Educational Services
- VectorVest OnLine
- VectorVest Options Analyzer
- VectorVest ProGraphics v6.0
- VectorVest ProTrader 7
- VectorVest RealTime Derby Tool
- VectorVest Simulator
- VectorVest Variator
- VectorVest Watchdog
