HOT TOPICS LIST
- MACD
- Fibonacci
- RSI
- Gann
- ADXR
- Stochastics
- Volume
- Triangles
- Futures
- Cycles
- Volatility
- ZIGZAG
- MESA
- Retracement
- Aroon
INDICATORS LIST
LIST OF TOPICS
PRINT THIS ARTICLE
by Koos van der Merwe
When a share price forms a double top and a double bottom, which one do you follow?
Position: Accumulate
Koos van der Merwe
Has been a technical analyst since 1969, and has worked as a futures and options trader with First Financial Futures in Johannesburg, South Africa.
PRINT THIS ARTICLE
TRITOP/TRI BOTTOM
Double Top Or Double Bottom?
04/16/12 01:53:45 PMby Koos van der Merwe
When a share price forms a double top and a double bottom, which one do you follow?
Position: Accumulate
| JDS Uniphase Corp. (JDSU) is a company that designs and manufactures products for optical communications networks, communications test and measurement equipment, lasers, optical solutions for authentication and decorative applications, and other custom optics. The Motley Fool recently queried the high goodwill figure on the company's balance sheet, but ended up recommending the company. What do the charts say? |

|
| FIGURE 1: JDSU, WEEKLY |
| Graphic provided by: AdvancedGET. |
| |
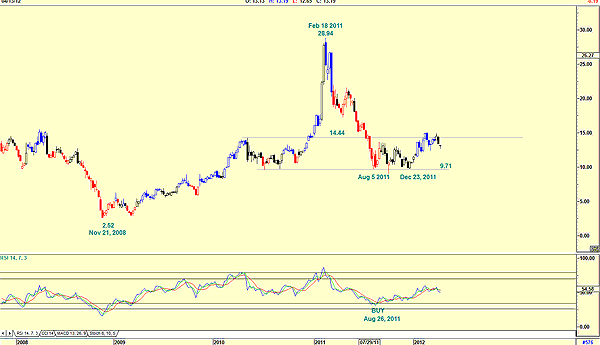
| Figure 1 is a weekly chart that shows how the price fell from a high of $28.94 in February 2011 to the low of $9.71 by August 2011. The chart also shows that in November 21, 2008, the share price was $2.52, so had we bought at that date, profits would have been very acceptable. At the moment, the relative strength index (RSI) on the weekly chart is showing strength, having given a buy on August 26, 2011. The share price does seem to have found resistance at the $14.44 level. Is this presenting a further buying opportunity? To answer this question, look at the daily chart in Figure 2. |

|
| FIGURE 2: JDSU, DAILY |
| Graphic provided by: AdvancedGET. |
| |
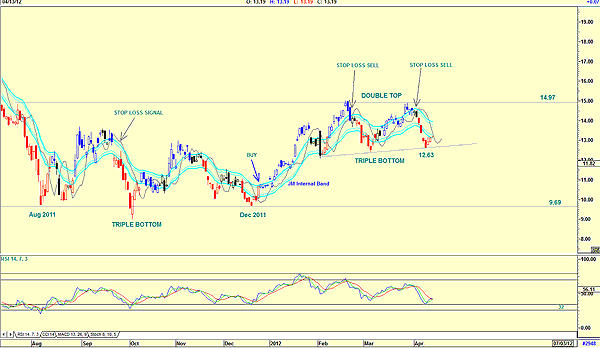
| The daily chart shows how the share price formed a triple bottom in the period from August 2011 to December 2011 at $9.69. The price then rose to form a double top at $14.97, with what could be a second triple bottom at approximately the $12.63 level. The chart shows the following indicators: a. The RSI, which based on previous signals, could have given a buy signal, even though it did not fall, below the 32 level. b. The JM internal band indicator. The price is still in short mode, as it is below the lower band level. The JM internal band is a 15-period exponential moving average offset by 2% (positive) and -2% (negative). c. The chart also shows a stop-loss indicator. This is a three-period simple moving average of the close four periods ago. d. The Tom Joseph XTL indicator, which colors the candlesticks blue, black, or red -- blue being buy mode, black neutral, and red a sell. The candlesticks are currently red, suggesting weakness. The only indicator that looks positive is the RSI, but the triple-bottom pattern does suggest that the share price should move up to test the $14.97 level. I would be a buyer of JDS Uniphase at this level for trading purposes. As an investor, I would wait for a break above the upper JM internal band, or a change in color of the candlestick to black or blue. |
Has been a technical analyst since 1969, and has worked as a futures and options trader with First Financial Futures in Johannesburg, South Africa.
| Address: | 3256 West 24th Ave |
| Vancouver, BC | |
| Phone # for sales: | 6042634214 |
| E-mail address: | petroosp@gmail.com |
Click here for more information about our publications!
PRINT THIS ARTICLE

Request Information From Our Sponsors
- VectorVest, Inc.
- Executive Premier Workshop
- One-Day Options Course
- OptionsPro
- Retirement Income Workshop
- Sure-Fire Trading Systems (VectorVest, Inc.)
- Trading as a Business Workshop
- VectorVest 7 EOD
- VectorVest 7 RealTime/IntraDay
- VectorVest AutoTester
- VectorVest Educational Services
- VectorVest OnLine
- VectorVest Options Analyzer
- VectorVest ProGraphics v6.0
- VectorVest ProTrader 7
- VectorVest RealTime Derby Tool
- VectorVest Simulator
- VectorVest Variator
- VectorVest Watchdog
- StockCharts.com, Inc.
- Candle Patterns
- Candlestick Charting Explained
- Intermarket Technical Analysis
- John Murphy on Chart Analysis
- John Murphy's Chart Pattern Recognition
- John Murphy's Market Message
- MurphyExplainsMarketAnalysis-Intermarket Analysis
- MurphyExplainsMarketAnalysis-Visual Analysis
- StockCharts.com
- Technical Analysis of the Financial Markets
- The Visual Investor
