HOT TOPICS LIST
- MACD
- Fibonacci
- RSI
- Gann
- ADXR
- Stochastics
- Volume
- Triangles
- Futures
- Cycles
- Volatility
- ZIGZAG
- MESA
- Retracement
- Aroon
INDICATORS LIST
LIST OF TOPICS
PRINT THIS ARTICLE
by Gary Grosschadl
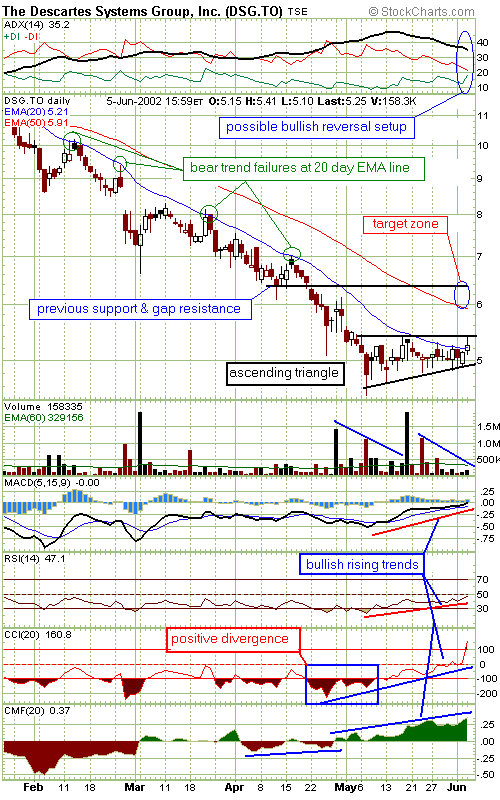
This battered Canadian tech stock (a logistics solutions provider) trading on Nasdaq and Toronto is starting to look interesting. It trades with better liquidity on the Canadian exchange and can suffer from bouts of lower volume. However, since a basing period has started, the volume profile has improved.
Position: N/A
Gary Grosschadl
Independent Canadian equities trader and technical analyst based in Peterborough
Ontario, Canada.
PRINT THIS ARTICLE
CHART ANALYSIS
Possibilities and Probabilites: An Ascending Triangle and Descartes Systems Group
06/06/02 09:41:14 AMby Gary Grosschadl
This battered Canadian tech stock (a logistics solutions provider) trading on Nasdaq and Toronto is starting to look interesting. It trades with better liquidity on the Canadian exchange and can suffer from bouts of lower volume. However, since a basing period has started, the volume profile has improved.
Position: N/A
| DSG has formed a bullish ascending triangle pattern and several indicators are also showing bullish signs. The ascending triangle is usually considered a continuation pattern but it can also act as a reversal pattern after a considerable downtrend. This bullish pattern indicates accumulation. Volume normally contracts as the triangle develops and except for a volume spike, this is the case here. |
| Several technical indicators are also looking bullish. The average directional index (ADX) is showing "high ADX pushing for DI crossover." This is a possible short-term reversal indicator hinting at buyers taking charge vs. the sellers. Buyers, or bulls, are in charge when +DI is above -DI. I consider this short-term because the medium- to long-term is still bearish as the stock is still trading below the weight of too many overhead moving averages- the 50-day EMA being a prominent one shown on the chart. |

|
| Graphic provided by: StockCharts.com. |
| |
| Other indicators displaying rising trends are the moving average convergence/divergence (MACD) , relative strength index (RSI), and the commodity channel index (CCI). Note that the CCI showed positive divergence, having made a higher low as the stock hit new lows. The Chaikin money flow Indicator (CMF) also confirms bullish accumulation, adding another vote of confidence to the ascending triangle pattern. |
| Traders should watch for bullish confirmations by virtue of an upside break on preferably higher volume and a corresponding move through the 50-day RSI level. The suggested target zone lies between the 50-day EMA line and a previous gap level. Note that by measuring the widest area of the ascending triangle, the triangle's upside target also roughly points to the gap resistance line shown. A move below the lower trendline negates any bullish view and is the downside risk. |
Independent Canadian equities trader and technical analyst based in Peterborough
Ontario, Canada.
| Website: | www.whatsonsale.ca/financial.html |
| E-mail address: | gwg7@sympatico.ca |
Click here for more information about our publications!
Comments
Date: 06/09/02Rank: 3Comment:
Date: 02/09/24Rank: 1Comment:

Request Information From Our Sponsors
- StockCharts.com, Inc.
- Candle Patterns
- Candlestick Charting Explained
- Intermarket Technical Analysis
- John Murphy on Chart Analysis
- John Murphy's Chart Pattern Recognition
- John Murphy's Market Message
- MurphyExplainsMarketAnalysis-Intermarket Analysis
- MurphyExplainsMarketAnalysis-Visual Analysis
- StockCharts.com
- Technical Analysis of the Financial Markets
- The Visual Investor
- VectorVest, Inc.
- Executive Premier Workshop
- One-Day Options Course
- OptionsPro
- Retirement Income Workshop
- Sure-Fire Trading Systems (VectorVest, Inc.)
- Trading as a Business Workshop
- VectorVest 7 EOD
- VectorVest 7 RealTime/IntraDay
- VectorVest AutoTester
- VectorVest Educational Services
- VectorVest OnLine
- VectorVest Options Analyzer
- VectorVest ProGraphics v6.0
- VectorVest ProTrader 7
- VectorVest RealTime Derby Tool
- VectorVest Simulator
- VectorVest Variator
- VectorVest Watchdog
