HOT TOPICS LIST
- MACD
- Fibonacci
- RSI
- Gann
- ADXR
- Stochastics
- Volume
- Triangles
- Futures
- Cycles
- Volatility
- ZIGZAG
- MESA
- Retracement
- Aroon
INDICATORS LIST
LIST OF TOPICS
PRINT THIS ARTICLE
by Chaitali Mohile
The extreme bearish conditions are likely to reverse the current rally of Priceline.com.
Position: Sell
Chaitali Mohile
Active trader in the Indian stock markets since 2003 and a full-time writer. Trading is largely based upon technical analysis.
PRINT THIS ARTICLE
CHART ANALYSIS
PCLN Is Extremely Bearish
04/17/12 02:30:37 PMby Chaitali Mohile
The extreme bearish conditions are likely to reverse the current rally of Priceline.com.
Position: Sell
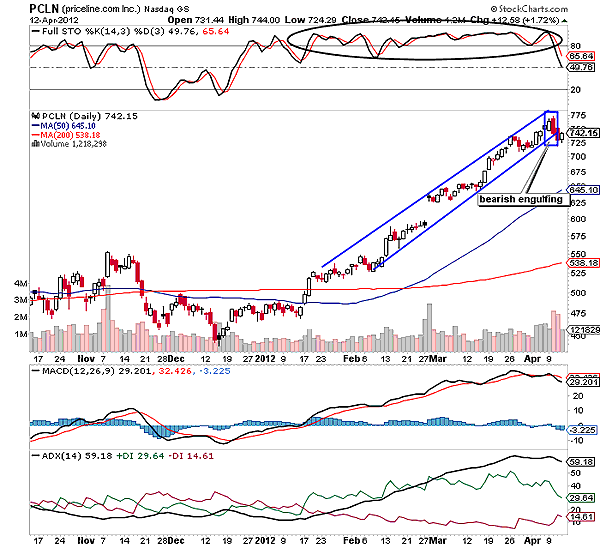
| Priceline.com (PCLN) has hit its all-time high at 775 levels. A bullish breakout occurred at 525 levels in early January 2012. The rally was initiated on very healthy notes; a trend that had been weak for many months reversed in favor of the bull. The average directional index (ADX) (14) in Figure 1 surged above 20 levels with increased buying pressure, developing a fresh uptrend for PCLN. Gradually, the price rally climbed higher. Meantime, the 50-day moving average (MA) also moved north, forming a bullish crossover on the price chart. During the journey, price underwent a small gap up, adding confidence in the rally. Thereafter, the rally continued with much stronger force. |
| Currently, the full stochastic (14,3,3) is highly overbought, indicating a reversal possibility. The moving average convergence/divergence (MACD) (12,26,9) has been positive for a much longer time and is likely to undergo a bearish crossover in positive territory. The bullish trend has turned highly overheated. In addition, the stock has formed a bearish engulfing pattern at 775 levels. This candlestick pattern is a bearish reversal that terminates the current bullish rally and initiates a fresh bearish move. Therefore, the extreme bearish conditions on the daily chart in Figure 1 would result in a short-term descending price rally. The new downside price action has a 50-day MA support at 640 levels. |

|
| FIGURE 1: PCLN, DAILY. The bullish rally is terminated by the bearish engulfing pattern formed at the top. |
| Graphic provided by: StockCharts.com. |
| |
| However, the retracing rally would pull down the overheated indicators to the healthy bullish region, and thus, the long-term uptrend and the bullish sentiments would not be harmed. Traders should watch to see if PCLN drops even more to fill the previous gap formation. The gap would be another support for the intermediate bearish rally. Since the decline would be minor, traders can look for a fast profit-booking opportunity on the short positions triggered at 750 levels. The target would be $650 with the stop-loss at 760 levels. |

|
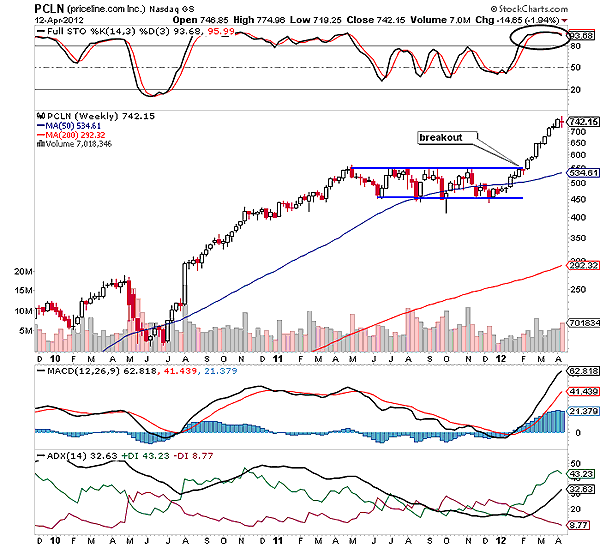
| FIGURE 2: PCLN, WEEKLY. The breakout rally made the new high at 775 levels. |
| Graphic provided by: StockCharts.com. |
| |
| According to the weekly time frame chart in Figure 2, PCLN was consolidating for about six months in 2011, forming a bullish flag & pennant -- a continuation pattern. The pattern was breached at 550 levels in an upward direction. After the breakout, PCLN surged to meet its possible target of 791 (561 - 320 = 241 + 550 = 791). The stock had made an all-time at 775 before slipping down a few points. The breakout rally was one-sided; all the three indicators in Figure 2 were highly supportive. But as the price moved closer to the target, the stochastic oscillator turned overbought and the MACD (12,26,9) surged higher in positive territory. Both the indicators are ready to reverse, which would create some room for the ascending rally. The ADX (14) is reflecting the developed uptrend in Figure 2. |
| Thus, PCLN is likely to tumble a few points from the current position without losing its bullish momentum. |
Active trader in the Indian stock markets since 2003 and a full-time writer. Trading is largely based upon technical analysis.
| Company: | Independent |
| Address: | C1/3 Parth Indraprasth Towers. Vastrapur |
| Ahmedabad, Guj 380015 | |
| E-mail address: | chaitalimohile@yahoo.co.in |
Traders' Resource Links | |
| Independent has not added any product or service information to TRADERS' RESOURCE. | |
Click here for more information about our publications!
PRINT THIS ARTICLE

Request Information From Our Sponsors
- VectorVest, Inc.
- Executive Premier Workshop
- One-Day Options Course
- OptionsPro
- Retirement Income Workshop
- Sure-Fire Trading Systems (VectorVest, Inc.)
- Trading as a Business Workshop
- VectorVest 7 EOD
- VectorVest 7 RealTime/IntraDay
- VectorVest AutoTester
- VectorVest Educational Services
- VectorVest OnLine
- VectorVest Options Analyzer
- VectorVest ProGraphics v6.0
- VectorVest ProTrader 7
- VectorVest RealTime Derby Tool
- VectorVest Simulator
- VectorVest Variator
- VectorVest Watchdog
- StockCharts.com, Inc.
- Candle Patterns
- Candlestick Charting Explained
- Intermarket Technical Analysis
- John Murphy on Chart Analysis
- John Murphy's Chart Pattern Recognition
- John Murphy's Market Message
- MurphyExplainsMarketAnalysis-Intermarket Analysis
- MurphyExplainsMarketAnalysis-Visual Analysis
- StockCharts.com
- Technical Analysis of the Financial Markets
- The Visual Investor
