HOT TOPICS LIST
- MACD
- Fibonacci
- RSI
- Gann
- ADXR
- Stochastics
- Volume
- Triangles
- Futures
- Cycles
- Volatility
- ZIGZAG
- MESA
- Retracement
- Aroon
INDICATORS LIST
LIST OF TOPICS
PRINT THIS ARTICLE
by Donald W. Pendergast, Jr.
Shares of Priceline.com have enjoyed an epic runup in price over the past few months. Is the current decline a buying opportunity or the start of a major trend reversal?
Position: N/A
Donald W. Pendergast, Jr.
Donald W. Pendergast is a financial markets consultant who offers specialized services to stock brokers and high net worth individuals who seek a better bottom line for their portfolios.
PRINT THIS ARTICLE
CYCLES
For PCLN, End Of The Line For Current Rally?
04/16/12 01:49:47 PMby Donald W. Pendergast, Jr.
Shares of Priceline.com have enjoyed an epic runup in price over the past few months. Is the current decline a buying opportunity or the start of a major trend reversal?
Position: N/A
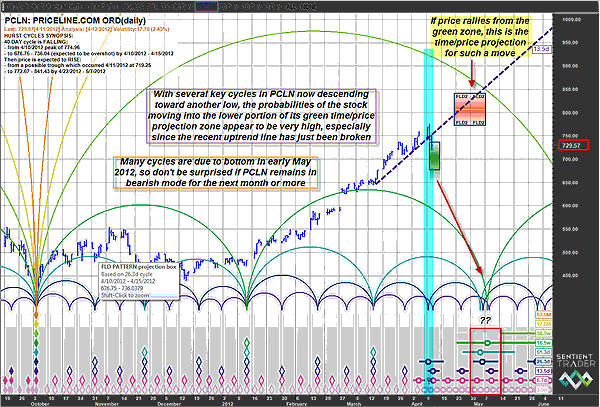
| There can be little doubt as to the strength of the powerful trend that has propelled shares of Priceline.com (PCLN) up as much as 76% between mid-December 2011 and mid-April 2012; it's almost a carbon copy of the trend that pushed shares of Apple Inc. (AAPL) up by a substantial amount during the same time period. It's not the same kind of mania-driven buying seen in the stock circa April 1999 or February-March 2000, but it's still impressive nonetheless. The stock is underpinned by good fundamentals and earnings growth potential, but as always, the big question after a big multimonth rally in any stock is simply this -- is the stock currently in a "buy the dips" mode, offering yet another low-risk opportunity to get onboard before another swing higher, or has the stock begun a major trend reversal, one destined to take back a significant portion of its recent gains? Here's a closer look at PCLN as we seek to look at the technical state of this NASDAQ powerhouse stock (Figure 1). |

|
| FIGURE 1: PCLN, DAILY. With five separate price cycles all heading lower, the line of least resistance in PCLN appears to be toward lower valuations, especially on a break below 719.25. |
| Graphic provided by: Sentient Trader. |
| |
| On the cycles ID chart, note the vertical blue shaded box that suggests -- based on this particular cycles-phasing analysis -- that at least five distinct price cycles driving PCLN are now moving lower. These are the 38.3- and 16.5-week cycles along with the daily 51.3-, 26.3-, and 13.5-day cycles. Also of note is the fact that the 13.5-day VTL (valid trendline, the blue dashed line on the chart) has been decisively broken; this break confirms the validity of the recent 26.3-day cycle's high. The green shaded time/price projection box offers a near-term idea as to where PCLN may be able to form a low before rallying again, possibly up into the red time/price projection box. While anything is possible in the stock market -- including another nice rally to new highs in PCLN by late April -- the fact that so many proven cycles are all moving lower would seem to imply that the line of least resistance in this stock is definitely toward lower valuations, at least until sometime in May 2012, which is when many of these cycles are anticipated to make major lows in the same general time window (see red outlined box on chart). |

|
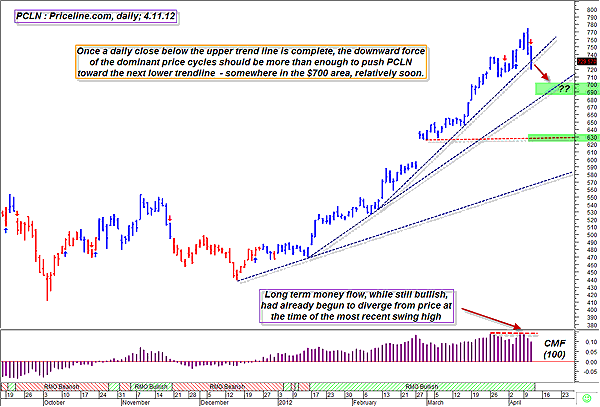
| FIGURE 2: PCLN, DAILY. With a new Rahul Mohindar (RMO) swing sell signal in place, a break below 719.25 could be the catalyst to bring PCLN down toward its first trendline support level near 690 to 700. |
| Graphic provided by: MetaStock. |
| Graphic provided by: RMO trading system indicators from MetaStock 11. |
| |
| In checking out another daily chart of PCLN (Figure 2), the key trendline support areas also offer some helpful clues as to where to expect support to manifest if PCLN's decline plays out as expected over the next month or two. The first major support comes in near 690 to 700, which should be reached within the next couple of weeks once the current (as of Thursday afternoon, April 12) relief rally in the broad markets stalls out and the selling starts again. Given the downward momentum in PCLN's dominant cycles, it also would not be surprising to see the stock drop as low as 630 as the next multicycle low is made, one that may make us decide if we want a test of the open gap near 630.00 before mounting a strong rally up out of that expected major cycle low. While all we can do as technicians and traders is to monitor price action day by day, acting on it in a thoughtful and responsible manner -- without making "set in stone" predictions on future price movements -- it still is nice to have leading indicators like price cycles, Fibonacci ratios, and trendlines all working in our favor to help us put the probabilities for trading success more squarely in our favor. For the present, one of the better trading opportunities in PCLN may be to buy put options (slightly in the money or at the money) with two to three months of time value, but only on a break below Wednesday's low of 719.25. The logical target would be the area of the first uptrend line, say somewhere around 700. This is an important psychological price point (as are all price levels in multiples of 10 or 100) and would be a great place to book a short-term profit and then stand aside, as volatility at such a key price zone might make it hard to stay with the position due to the chance of wild intraday swings in either direction. Of course, if you choose to make such a trade, always limit your risk and don't get married to such a position, setting wise initial stops and profit targets. |
Donald W. Pendergast is a financial markets consultant who offers specialized services to stock brokers and high net worth individuals who seek a better bottom line for their portfolios.
| Title: | Writer, market consultant |
| Company: | Linear Trading Systems LLC |
| Jacksonville, FL 32217 | |
| Phone # for sales: | 904-239-9564 |
| E-mail address: | lineartradingsys@gmail.com |
Traders' Resource Links | |
| Linear Trading Systems LLC has not added any product or service information to TRADERS' RESOURCE. | |
Click here for more information about our publications!
Comments

|

Request Information From Our Sponsors
- StockCharts.com, Inc.
- Candle Patterns
- Candlestick Charting Explained
- Intermarket Technical Analysis
- John Murphy on Chart Analysis
- John Murphy's Chart Pattern Recognition
- John Murphy's Market Message
- MurphyExplainsMarketAnalysis-Intermarket Analysis
- MurphyExplainsMarketAnalysis-Visual Analysis
- StockCharts.com
- Technical Analysis of the Financial Markets
- The Visual Investor
- VectorVest, Inc.
- Executive Premier Workshop
- One-Day Options Course
- OptionsPro
- Retirement Income Workshop
- Sure-Fire Trading Systems (VectorVest, Inc.)
- Trading as a Business Workshop
- VectorVest 7 EOD
- VectorVest 7 RealTime/IntraDay
- VectorVest AutoTester
- VectorVest Educational Services
- VectorVest OnLine
- VectorVest Options Analyzer
- VectorVest ProGraphics v6.0
- VectorVest ProTrader 7
- VectorVest RealTime Derby Tool
- VectorVest Simulator
- VectorVest Variator
- VectorVest Watchdog
