HOT TOPICS LIST
- MACD
- Fibonacci
- RSI
- Gann
- ADXR
- Stochastics
- Volume
- Triangles
- Futures
- Cycles
- Volatility
- ZIGZAG
- MESA
- Retracement
- Aroon
INDICATORS LIST
LIST OF TOPICS
PRINT THIS ARTICLE
by Mike Carr, CMT
With fears of Iran receding to the back of newspapers, the risk premium in oil could drop and the trend seems to be changing directions.
Position: Sell
Mike Carr, CMT
Mike Carr, CMT, is a member of the Market Technicians Association, and editor of the MTA's newsletter, Technically Speaking. He is also the author of "Smarter Investing in Any Economy: The Definitive Guide to Relative Strength Investing," and "Conquering the Divide: How to Use Economic Indicators to Catch Stock Market Trends."
PRINT THIS ARTICLE
RATE OF CHANGE
Crude Oil Set To Fall
04/13/12 09:01:59 AMby Mike Carr, CMT
With fears of Iran receding to the back of newspapers, the risk premium in oil could drop and the trend seems to be changing directions.
Position: Sell
| Oil has had a long runup as the economy recovered slightly and saber rattling in the Middle East caused market jitters. Crude oil futures gained more than 40% from their October lows before putting in at least a short-term top in late February. While the outcome of the long-running standoff with Iran is far from certain, traders seem to be signaling that they think the chances of a supply disruption are decreasing. Oil has been falling and several technical indicators are confirming that the change in direction to the down side could be a lasting one. Prices are more than 8% below their highs, and it now appears that a topping pattern has formed on the chart. |
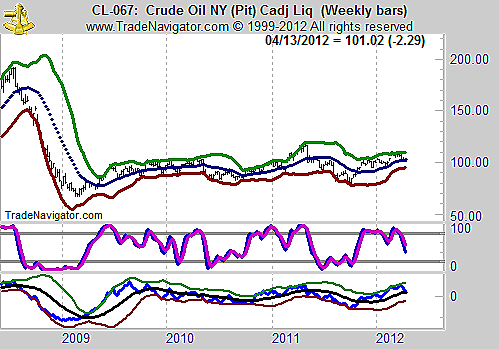
| There are a number of indicators that show oil could be starting a downtrend. The weekly chart is shown in Figure 1. In the top part of the chart, we can see that oil has fallen below its 20-week moving average and the stochastic indicator has turned low. The 26-week rate of change (ROC) is shown in the bottom of the chart and that indicator has also fallen below its 20-week moving average. Oil has made extended price moves to the down side when this indicator has been below its moving average. |

|
| FIGURE 1: CRUDE OIL, WEEKLY. Crude oil is showing signs of a top in the price pattern and based on several indicators. |
| Graphic provided by: Trade Navigator. |
| |
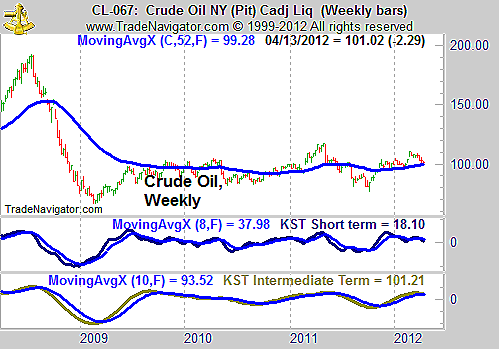
| In Figure 2, oil is shown with the KST indicator, developed by analyst Martin Pring. KST is a summed and smoothed rate of change indicator. It uses a weighted sum of four different rates of change smoothed with moving averages. As an example, you could use a six-month moving average of the nine-, 12-, and 18-month rates of change and a nine-month moving average of the 24-month ROC. The shortest time frame is weighted a fourth as much as the longest, while the other two ROCs are weighted proportionally. The result is shown in Figure 2. Pring advocated measuring KST over three time frames and comparing the indicator to a moving average. |

|
| FIGURE 2: CRUDE OIL, WEEKLY. KST is offering additional support for bearishness in crude oil. |
| Graphic provided by: Trade Navigator. |
| |
| The weekly chart of oil shows that the price is testing the 52-week moving average, the short-term KST has turned down, and the intermediate-term KST is set to follow. The long-term KST is also bearish. KST in this case confirms the bearishness of other indicators. However, anything can happen in the markets, especially one as volatile as oil, and traders should use a stop near the February highs if they short oil. |
Mike Carr, CMT, is a member of the Market Technicians Association, and editor of the MTA's newsletter, Technically Speaking. He is also the author of "Smarter Investing in Any Economy: The Definitive Guide to Relative Strength Investing," and "Conquering the Divide: How to Use Economic Indicators to Catch Stock Market Trends."
| Website: | www.moneynews.com/blogs/MichaelCarr/id-73 |
| E-mail address: | marketstrategist@gmail.com |
Click here for more information about our publications!
PRINT THIS ARTICLE

Request Information From Our Sponsors
- StockCharts.com, Inc.
- Candle Patterns
- Candlestick Charting Explained
- Intermarket Technical Analysis
- John Murphy on Chart Analysis
- John Murphy's Chart Pattern Recognition
- John Murphy's Market Message
- MurphyExplainsMarketAnalysis-Intermarket Analysis
- MurphyExplainsMarketAnalysis-Visual Analysis
- StockCharts.com
- Technical Analysis of the Financial Markets
- The Visual Investor
- VectorVest, Inc.
- Executive Premier Workshop
- One-Day Options Course
- OptionsPro
- Retirement Income Workshop
- Sure-Fire Trading Systems (VectorVest, Inc.)
- Trading as a Business Workshop
- VectorVest 7 EOD
- VectorVest 7 RealTime/IntraDay
- VectorVest AutoTester
- VectorVest Educational Services
- VectorVest OnLine
- VectorVest Options Analyzer
- VectorVest ProGraphics v6.0
- VectorVest ProTrader 7
- VectorVest RealTime Derby Tool
- VectorVest Simulator
- VectorVest Variator
- VectorVest Watchdog
