HOT TOPICS LIST
- MACD
- Fibonacci
- RSI
- Gann
- ADXR
- Stochastics
- Volume
- Triangles
- Futures
- Cycles
- Volatility
- ZIGZAG
- MESA
- Retracement
- Aroon
INDICATORS LIST
LIST OF TOPICS
PRINT THIS ARTICLE
by Donald W. Pendergast, Jr.
When a steady, long-term uptrend ends in a shocking selloff, don't expect a strong rebound right away.
Position: N/A
Donald W. Pendergast, Jr.
Donald W. Pendergast is a financial markets consultant who offers specialized services to stock brokers and high net worth individuals who seek a better bottom line for their portfolios.
PRINT THIS ARTICLE
CHART ANALYSIS
For STZ, 200-Day EMA Offering Temporary Support?
04/13/12 11:20:17 AMby Donald W. Pendergast, Jr.
When a steady, long-term uptrend ends in a shocking selloff, don't expect a strong rebound right away.
Position: N/A
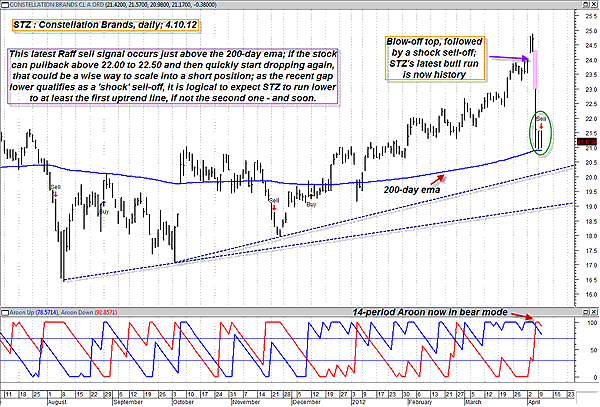
| Like many other large-cap stocks, shares of Constellation Brands (STZ) don't exactly tear up the tracks during their respective bull and bear market runs, but one thing that most of these slower-plodding giants do have in common with their small-cap brethren is that when one of their long-term uptrends comes to a crashing halt -- with a shocker of a selloff -- the chances for a quick resumption of that trend is virtually nil. As we look at the daily graph of STZ (Figure 1), the most prominent technical clue that this is not a typical pullback buying opportunity because of the huge bearish gap that launched this swift and violent selloff. When you see these situations appear time and again on all kinds of charts over a three-decade span, you get a fairly good feel for what the aftermath of such a sudden trend reversal might eventually look like, and in most cases, the initial shock selloff phase is only the first leg lower before a meaningful multicycle low can be achieved, one that can actually launch a sustainable rally. In a three-day period, STZ's recent plunge wiped out more than two months of hard-won prior gains for shareholders. Hopefully, they had already begun scaling out of their existing long positions after such a long rally or at least bailed out on last Thursday's open, once the giant, bearish opening gap was already a done deal. Technically, the stock is now perched just above the big daddy of moving averages -- the 200-day exponential moving average (EMA) (the 200-day simple moving average is also widely watched as well). A new Raff MarketSpace sell signal has printed at this juncture, but it may not be wise to short a stock into a major moving average support zone, especially the first time it makes contact. However, given that such sudden trend reversals to the downside almost always result in even more selling pressure, one of the wiser strategies to use in this case might be to wait for a modest pullback -- perhaps up toward 22.00 to 23.00 and see if the selling really gets going again, with the 14-period Aroon trend intensity indicator getting pushed to its maximum bearish reading (which would be having its red line at the top of its range with a reading of 100). Witnessing a second round of selling like this might offer a safer way to start nibbling on the short side rather than attempting to go short near the 200-day EMA right now. |

|
| FIGURE 1: STZ, DAILY. Typically, when a trend ends in a violent fashion like that shown here, there is still another wave of seeling to follow -- usually after a minor rebound. The two trendlines may offer guidance as to where to expect future support to manifest. |
| Graphic provided by: MetaStock. |
| Graphic provided by: Raff MarketSpace expert from MetaStock 11. |
| |
| As far as potential support levels go, the two existing long-term uptrend lines offer the most logical clues for where to expect STZ to find at least temporary support, if not the formation of a multicycle low worth trading from the long side. The lower of the two trendlines is the most likely zone for this cyclical low to be expected, by the way, probably by late May to early June of this year. STZ also features poor relative strength versus the .SPX, so there are a number of bearish factors at play in STZ's decline to lower valuations. Buying at the money or slightly in the money puts on a second wave of selling (after a mild bounce) that takes STZ below its 200-day EMA look like a trading tactic to consider, using the upper trendline as the logical profit target. But make sure you limit any potential damage to your account by risking no more than 1% to 2% of your account value on any such trade, no matter how strongly bearish you may feel about STZ's current price action. See Figure 2. |

|
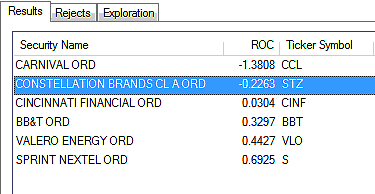
| FIGURE 2: LARGE-CAP STOCKS. Here are the six large-cap stocks firing Raff sell signals, which are also underperforming the .SPX over the past calendar quarter. |
| Graphic provided by: MetaStock. |
| Graphic provided by: MetaStock Explorer. |
| |
Donald W. Pendergast is a financial markets consultant who offers specialized services to stock brokers and high net worth individuals who seek a better bottom line for their portfolios.
| Title: | Writer, market consultant |
| Company: | Linear Trading Systems LLC |
| Jacksonville, FL 32217 | |
| Phone # for sales: | 904-239-9564 |
| E-mail address: | lineartradingsys@gmail.com |
Traders' Resource Links | |
| Linear Trading Systems LLC has not added any product or service information to TRADERS' RESOURCE. | |
Click here for more information about our publications!
Comments

Request Information From Our Sponsors
- StockCharts.com, Inc.
- Candle Patterns
- Candlestick Charting Explained
- Intermarket Technical Analysis
- John Murphy on Chart Analysis
- John Murphy's Chart Pattern Recognition
- John Murphy's Market Message
- MurphyExplainsMarketAnalysis-Intermarket Analysis
- MurphyExplainsMarketAnalysis-Visual Analysis
- StockCharts.com
- Technical Analysis of the Financial Markets
- The Visual Investor
- VectorVest, Inc.
- Executive Premier Workshop
- One-Day Options Course
- OptionsPro
- Retirement Income Workshop
- Sure-Fire Trading Systems (VectorVest, Inc.)
- Trading as a Business Workshop
- VectorVest 7 EOD
- VectorVest 7 RealTime/IntraDay
- VectorVest AutoTester
- VectorVest Educational Services
- VectorVest OnLine
- VectorVest Options Analyzer
- VectorVest ProGraphics v6.0
- VectorVest ProTrader 7
- VectorVest RealTime Derby Tool
- VectorVest Simulator
- VectorVest Variator
- VectorVest Watchdog
