HOT TOPICS LIST
- MACD
- Fibonacci
- RSI
- Gann
- ADXR
- Stochastics
- Volume
- Triangles
- Futures
- Cycles
- Volatility
- ZIGZAG
- MESA
- Retracement
- Aroon
INDICATORS LIST
LIST OF TOPICS
PRINT THIS ARTICLE
by Koos van der Merwe
A candlestick hammer is a sign of a trend reversal. What's it say about Bank of America?
Position: Accumulate
Koos van der Merwe
Has been a technical analyst since 1969, and has worked as a futures and options trader with First Financial Futures in Johannesburg, South Africa.
PRINT THIS ARTICLE
CANDLESTICK CHARTING
A Candlestick Hammer Arises On BAC
04/12/12 08:40:43 AMby Koos van der Merwe
A candlestick hammer is a sign of a trend reversal. What's it say about Bank of America?
Position: Accumulate
| The hammer is a one-day formation that consists of a small body with little or no upper shadow and a lower shadow that is twice the length of the body. The lowest value is lower than any value over the previous three days. In a downtrend, the formation signals a rally. |

|
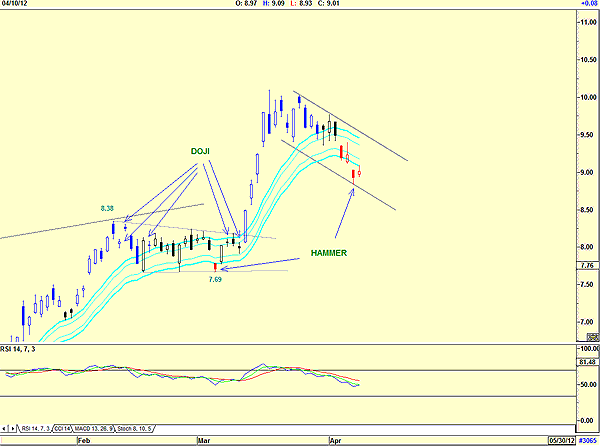
| FIGURE 1: BAC. Here are hammer and doji formations. |
| Graphic provided by: AdvancedGET. |
| |
| In Figure 1, I have highlighted two candlestick formations that look like a hammer, but neither of them meets the true definition of one. Could we therefore assume that the two patterns could act like hammers? The pattern given when the price reached $7.69 has some of the features of a hammer, but the lower shadow is not twice the length of the body, so even though on the chart I have called it a hammer, it is in fact not one. Yet it did signal a major reversal in the trend. The price moved up sharply, then formed a doji, corrected down for two days into another doji. A doji is where the open and close of a day's trading session are the same or very close. An upper and lower shadow must exist. A doji signals a trend reversal. |

|
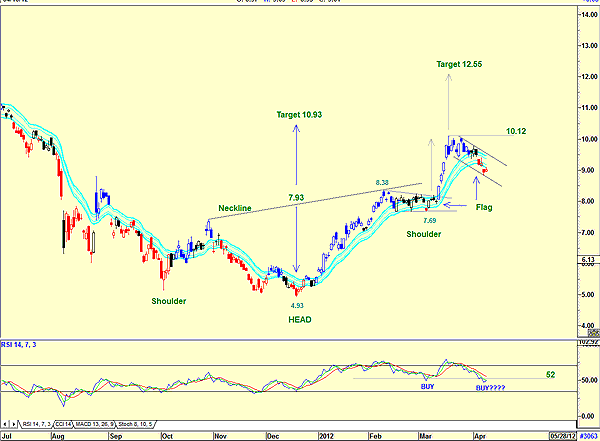
| FIGURE 2: BAC. Here are a head & shoulders formation and a flag formation. |
| Graphic provided by: AdvancedGET. |
| |
| Figure 2 shows a head & shoulders pattern, giving a target of $10.93. The chart does show that Bank of America (BAC) found strong resistance at the $10.00 level. From there it appears to be falling in a flag pattern. This gives it a target of $12.55 (10.12 - 7.69 = 2.43 + 10.12 = 12.55). With the relative strength index (RSI) falling below the 52 level, a level that gave a previous buy signal, a move up does appear very likely. The level of $10.00 will act as a resistance, but once broken, the target of $12.55 is very possible. I would be a buyer of BAC on every correction. |
Has been a technical analyst since 1969, and has worked as a futures and options trader with First Financial Futures in Johannesburg, South Africa.
| Address: | 3256 West 24th Ave |
| Vancouver, BC | |
| Phone # for sales: | 6042634214 |
| E-mail address: | petroosp@gmail.com |
Click here for more information about our publications!
PRINT THIS ARTICLE

Request Information From Our Sponsors
- StockCharts.com, Inc.
- Candle Patterns
- Candlestick Charting Explained
- Intermarket Technical Analysis
- John Murphy on Chart Analysis
- John Murphy's Chart Pattern Recognition
- John Murphy's Market Message
- MurphyExplainsMarketAnalysis-Intermarket Analysis
- MurphyExplainsMarketAnalysis-Visual Analysis
- StockCharts.com
- Technical Analysis of the Financial Markets
- The Visual Investor
- VectorVest, Inc.
- Executive Premier Workshop
- One-Day Options Course
- OptionsPro
- Retirement Income Workshop
- Sure-Fire Trading Systems (VectorVest, Inc.)
- Trading as a Business Workshop
- VectorVest 7 EOD
- VectorVest 7 RealTime/IntraDay
- VectorVest AutoTester
- VectorVest Educational Services
- VectorVest OnLine
- VectorVest Options Analyzer
- VectorVest ProGraphics v6.0
- VectorVest ProTrader 7
- VectorVest RealTime Derby Tool
- VectorVest Simulator
- VectorVest Variator
- VectorVest Watchdog
