HOT TOPICS LIST
- MACD
- Fibonacci
- RSI
- Gann
- ADXR
- Stochastics
- Volume
- Triangles
- Futures
- Cycles
- Volatility
- ZIGZAG
- MESA
- Retracement
- Aroon
INDICATORS LIST
LIST OF TOPICS
PRINT THIS ARTICLE
by Donald W. Pendergast, Jr.
After enduring a 35% selloff in five months, might shares of Newmont Mining be ready to make another significant low?
Position: N/A
Donald W. Pendergast, Jr.
Donald W. Pendergast is a financial markets consultant who offers specialized services to stock brokers and high net worth individuals who seek a better bottom line for their portfolios.
PRINT THIS ARTICLE
CYCLES
Newmont Mining Closing In On A Low?
04/12/12 08:31:04 AMby Donald W. Pendergast, Jr.
After enduring a 35% selloff in five months, might shares of Newmont Mining be ready to make another significant low?
Position: N/A
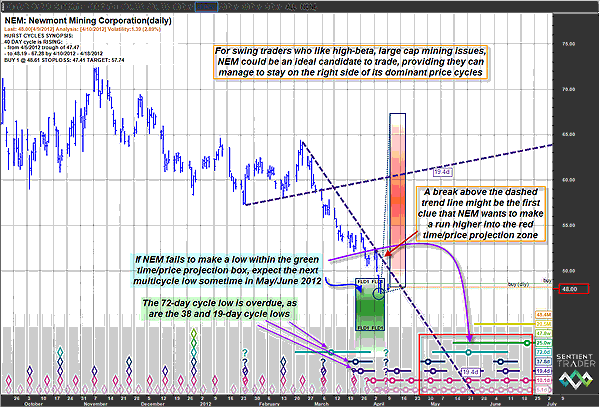
| Precious metals mining stocks are unique in that they don't always tend to bottom or peak along with the broad stock indexes. There are exceptions to this, of course, but it is fascinating to witness mining shares going their own merry way, regardless of what the .SPX or other major stock indexes are doing. Take Tuesday, April 10, 2012, for example: while the .SPX was busy plunging below one of its key Fibonacci support levels (see my most recent Traders.com Advantage piece for more details), shares of Newmont Mining (NEM) were up by as much as 3.5% at the time of this writing. The reasons could be anything -- perhaps fund managers view NEM as a value play after its five-month-long slide or perhaps investors are beginning to flock to gold again, fearing another full-scale correction in the US stock market -- which would, ironically, help drive up the prices of gold miners like NEM. Who knows? All we need to focus on is the price action on the charts after all is said and done. Glancing at Figure 1, we find that NEM's current downswing, one that commenced six weeks ago in mid-February, is still in motion. However, the stock is now nestled within its green time/price projection box (Sentient Trader calculates these based on the price cycles it has identified) and needs to turn higher soon if that particular forecast is to prove out. Note that three of NEM's key price cycles, the 19-, 38-, and 78-day cycle lows, are all overdue, and given the powerful intraday rally that occurred this past Tuesday, it is possible that NEM has indeed made an important multicycle low in this period of time. However, for the cycle low to be confirmed (especially the 38-day cycle), NEM must soon make a convincing daily close above the dashed blue trendline. If we witness that event soon, then NEM stands a much better chance of rising into the red shaded time/projection zone, the upper region of which, if reached, would allow NEM to recoup a sizable amount of the losses since last November. NEM will face modest chart and/or Fibonacci resistance near 52.00, 54.00, and 57.00, which is also something to keep in mind after such a long, drawn-out correction. The odds favor a bear market rally in NEM at this point and not the initiation of a brand-new bull run in the stock. Of further interest is the late April to late June 2012 time window (highlighted in red at bottom of the chart), which is where a number of significant price cycles may eventually fall together into a significant and highly tradable cycle low. Depending on how far NEM rallies in the wake, any further selling after the stock makes its next rally may very well price the stock down to lower levels later this spring. |

|
| FIGURE 1: NEM, DAILY. Cyclical analysis reveals that NEM may be at or very near to making a meaningful, mutlicycle low. A break above the dashed trendline will help confirm that the 38-day cycle low is in place. |
| Graphic provided by: Sentient Trader. |
| |
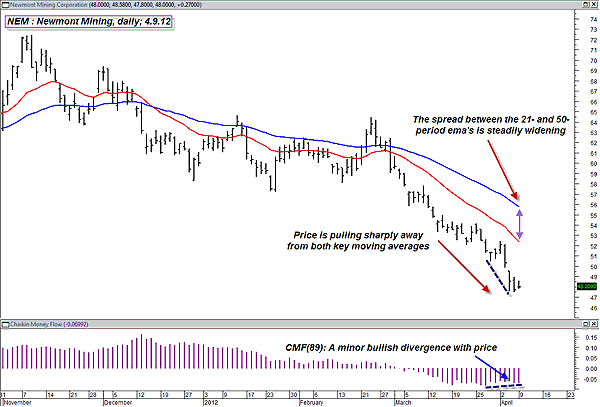
| Looking at a different daily chart for NEM (Figure 2), we can easily confirm the fact that the stock has been falling at an increased rate of downward momentum, with the spread of its 21- and 50-day exponential moving averages (EMAs) steadily widening in recent sessions. Long-term money flow (based on the 89-day Chaikin money flow [CMF][89] histogram) is still negative, although there is a minor bullish divergence with price, something that generally occurs before a market makes a trend reversal. Overall, while the technicals for NEM are still bearish, there is enough cyclical and money flow evidence to suggest that a tradable low may soon be (or already is) at hand. Look for a break and then a daily close above the blue-dashed downtrend line to confirm the 38-day cycle low and then rely on your chosen technical triggers to time long entries that are suitable for your account size and trading temperament, making sure you never risk more than 1% or 2% of your account value on any individual trade. |

|
| FIGURE 2: NEM, DAILY. NEM's downward momentum has been increasing as of late, but there is a minor price/money flow divergence evident that could be a hint that the stock is under accumulation by the smart money. Time will tell how all of this works out. |
| Graphic provided by: MetaStock. |
| |
Donald W. Pendergast is a financial markets consultant who offers specialized services to stock brokers and high net worth individuals who seek a better bottom line for their portfolios.
| Title: | Writer, market consultant |
| Company: | Linear Trading Systems LLC |
| Jacksonville, FL 32217 | |
| Phone # for sales: | 904-239-9564 |
| E-mail address: | lineartradingsys@gmail.com |
Traders' Resource Links | |
| Linear Trading Systems LLC has not added any product or service information to TRADERS' RESOURCE. | |
Click here for more information about our publications!
PRINT THIS ARTICLE

Request Information From Our Sponsors
- StockCharts.com, Inc.
- Candle Patterns
- Candlestick Charting Explained
- Intermarket Technical Analysis
- John Murphy on Chart Analysis
- John Murphy's Chart Pattern Recognition
- John Murphy's Market Message
- MurphyExplainsMarketAnalysis-Intermarket Analysis
- MurphyExplainsMarketAnalysis-Visual Analysis
- StockCharts.com
- Technical Analysis of the Financial Markets
- The Visual Investor
- VectorVest, Inc.
- Executive Premier Workshop
- One-Day Options Course
- OptionsPro
- Retirement Income Workshop
- Sure-Fire Trading Systems (VectorVest, Inc.)
- Trading as a Business Workshop
- VectorVest 7 EOD
- VectorVest 7 RealTime/IntraDay
- VectorVest AutoTester
- VectorVest Educational Services
- VectorVest OnLine
- VectorVest Options Analyzer
- VectorVest ProGraphics v6.0
- VectorVest ProTrader 7
- VectorVest RealTime Derby Tool
- VectorVest Simulator
- VectorVest Variator
- VectorVest Watchdog
